Maintaining Engine Health: Triage Index Fragmentation and Outdated Statistics
Optimizing physical and logical data access paths: A deep dive into tracking page splits, auditing modification counters, and updating stale distribution histograms for peak engine efficiency.
Imagine stepping into your corporate office, picking up a physical company phone directory to find a colleague's extension, only to realize two major problems: half the pages are torn out of alphabetical order, and the names haven't been updated since 2021. You would waste massive amounts of time flipping back and forth through scrambled pages, calling outdated numbers that no longer exist.
In SQL Server, the exact same scenario unfolds when you let your database Index Fragmentation and Data Statistics degrade.
When an application execution slows to a crawl, junior engineers often assume the query code itself is poorly written. However, if the underlying indexes are physically fragmented or the optimizer’s data maps are stale, even a perfectly crafted SELECT query will trigger massive storage I/O bottlenecks. Let's demystify index fragmentation, learn how to hunt down outdated statistics, and deploy production-ready maintenance scripts.
1. The Twin Bottlenecks: Scrambled Pages vs. Stale Maps
To optimize your data access paths, you must understand the distinct roles of physical layout (Indexes) and mathematical metadata (Statistics).
Index Fragmentation is a Physical Layout Issue: When data rows are modified or inserted, 8KB data pages can split apart. Instead of pages sitting sequentially next to each other on your storage drive, they become scattered. The storage engine is forced to execute randomized disk reads rather than clean sequential scans.
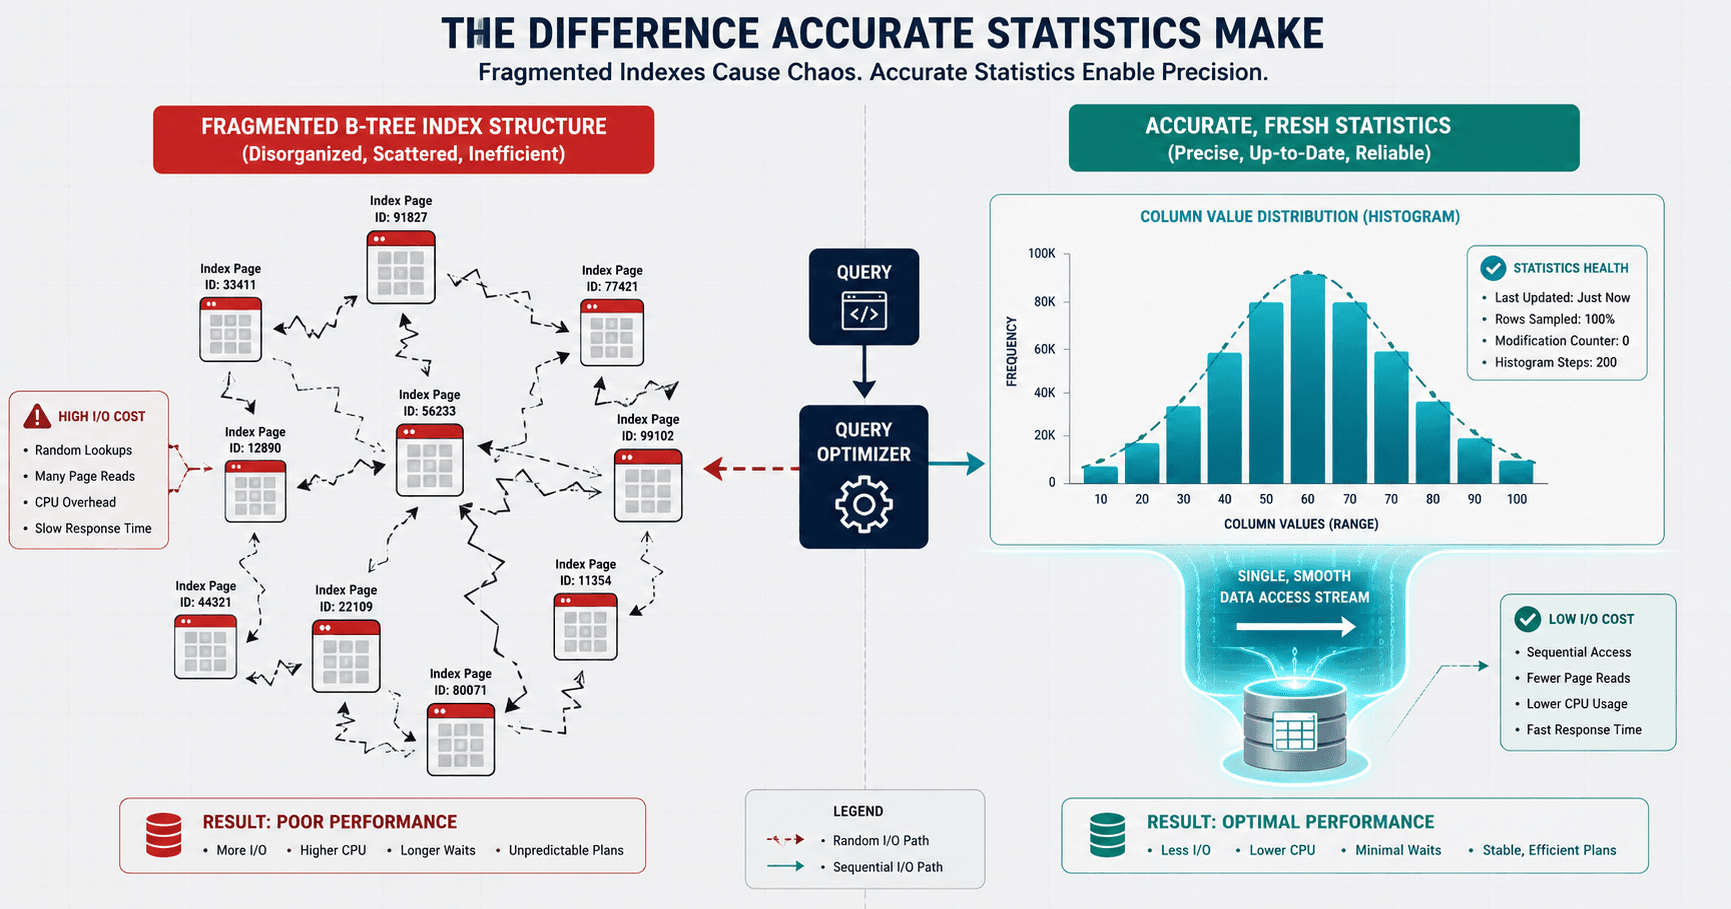
Outdated Statistics is an Information Issue: Statistics are small, lightweight distribution maps (histograms) that tell the Query Optimizer how many rows match a specific value. If a table undergoes heavy data modifications and the statistics are stale, the optimizer behaves like it is navigating a city with a 10-year-old road map. It cannot guess correct row counts (cardinality), forcing it to pick terrible execution plans.
2. Diagram 1: Clean Sequential Pages vs. Split Page Fragmentation
Visualizing how data pages split apart under heavy INSERT or UPDATE pressure helps junior administrators understand why storage drives experience sudden I/O spikes.

3. Auditing the Physical Layer: Tracking Index Fragmentation
Do not guess whether your indexes require physical maintenance. Query the live storage engine metadata catalog view sys.dm_db_index_physical_stats to extract the exact fragmentation percentages across your database schemas:
SELECT
    OBJECT_NAME(ips.object_id) AS [TableName],
    i.name AS [IndexName],
    ips.index_type_desc AS [IndexType],
    -- The core alignment metric to track
    CAST(ips.avg_fragmentation_in_percent AS DECIMAL(5,2)) AS [Fragmentation_Percent],
    ips.page_count AS [TotalPhysicalPages],
    -- Internal fragmentation metric (How full are the individual 8KB pages?)
    CAST(ips.avg_page_space_used_in_percent AS DECIMAL(5,2)) AS [AveragePageFullness_Percent]
FROM sys.dm_db_index_physical_stats(DB_ID(), NULL, NULL, NULL, 'LIMITED') ips
JOIN sys.indexes i ON ips.object_id = i.object_id AND ips.index_id = i.index_id
WHERE ips.avg_fragmentation_in_percent > 5.0 -- Filters out unfragmented small lookup indexes
  AND ips.page_count > 1000 -- Ignores tiny tables where fragmentation has zero impact on performance
ORDER BY [Fragmentation_Percent] DESC;
GO
The Standard DBA Maintenance Rule
When reading your script results, use these industry-standard operational threshold boundaries to remediate fragmentation bottlenecks:
| Fragmentation Level | Correct Action | Internal Mechanism |
|---|---|---|
| Between 5% and 30% | ALTER INDEX ... REORGANIZE |
An online operation that gracefully compacts pages and re-orders the leaf levels without dropping or locking the index structures. |
| Greater than 30% | ALTER INDEX ... REBUILD |
An intensive operation that drops the old index and constructs a completely fresh, contiguous B-Tree from scratch, resetting space allocations. |
4. Unmasking Stale Data Maps: Tracking Outdated Statistics
Even if your indexes show 0% fragmentation, your queries can still collapse if your Statistics are outdated.
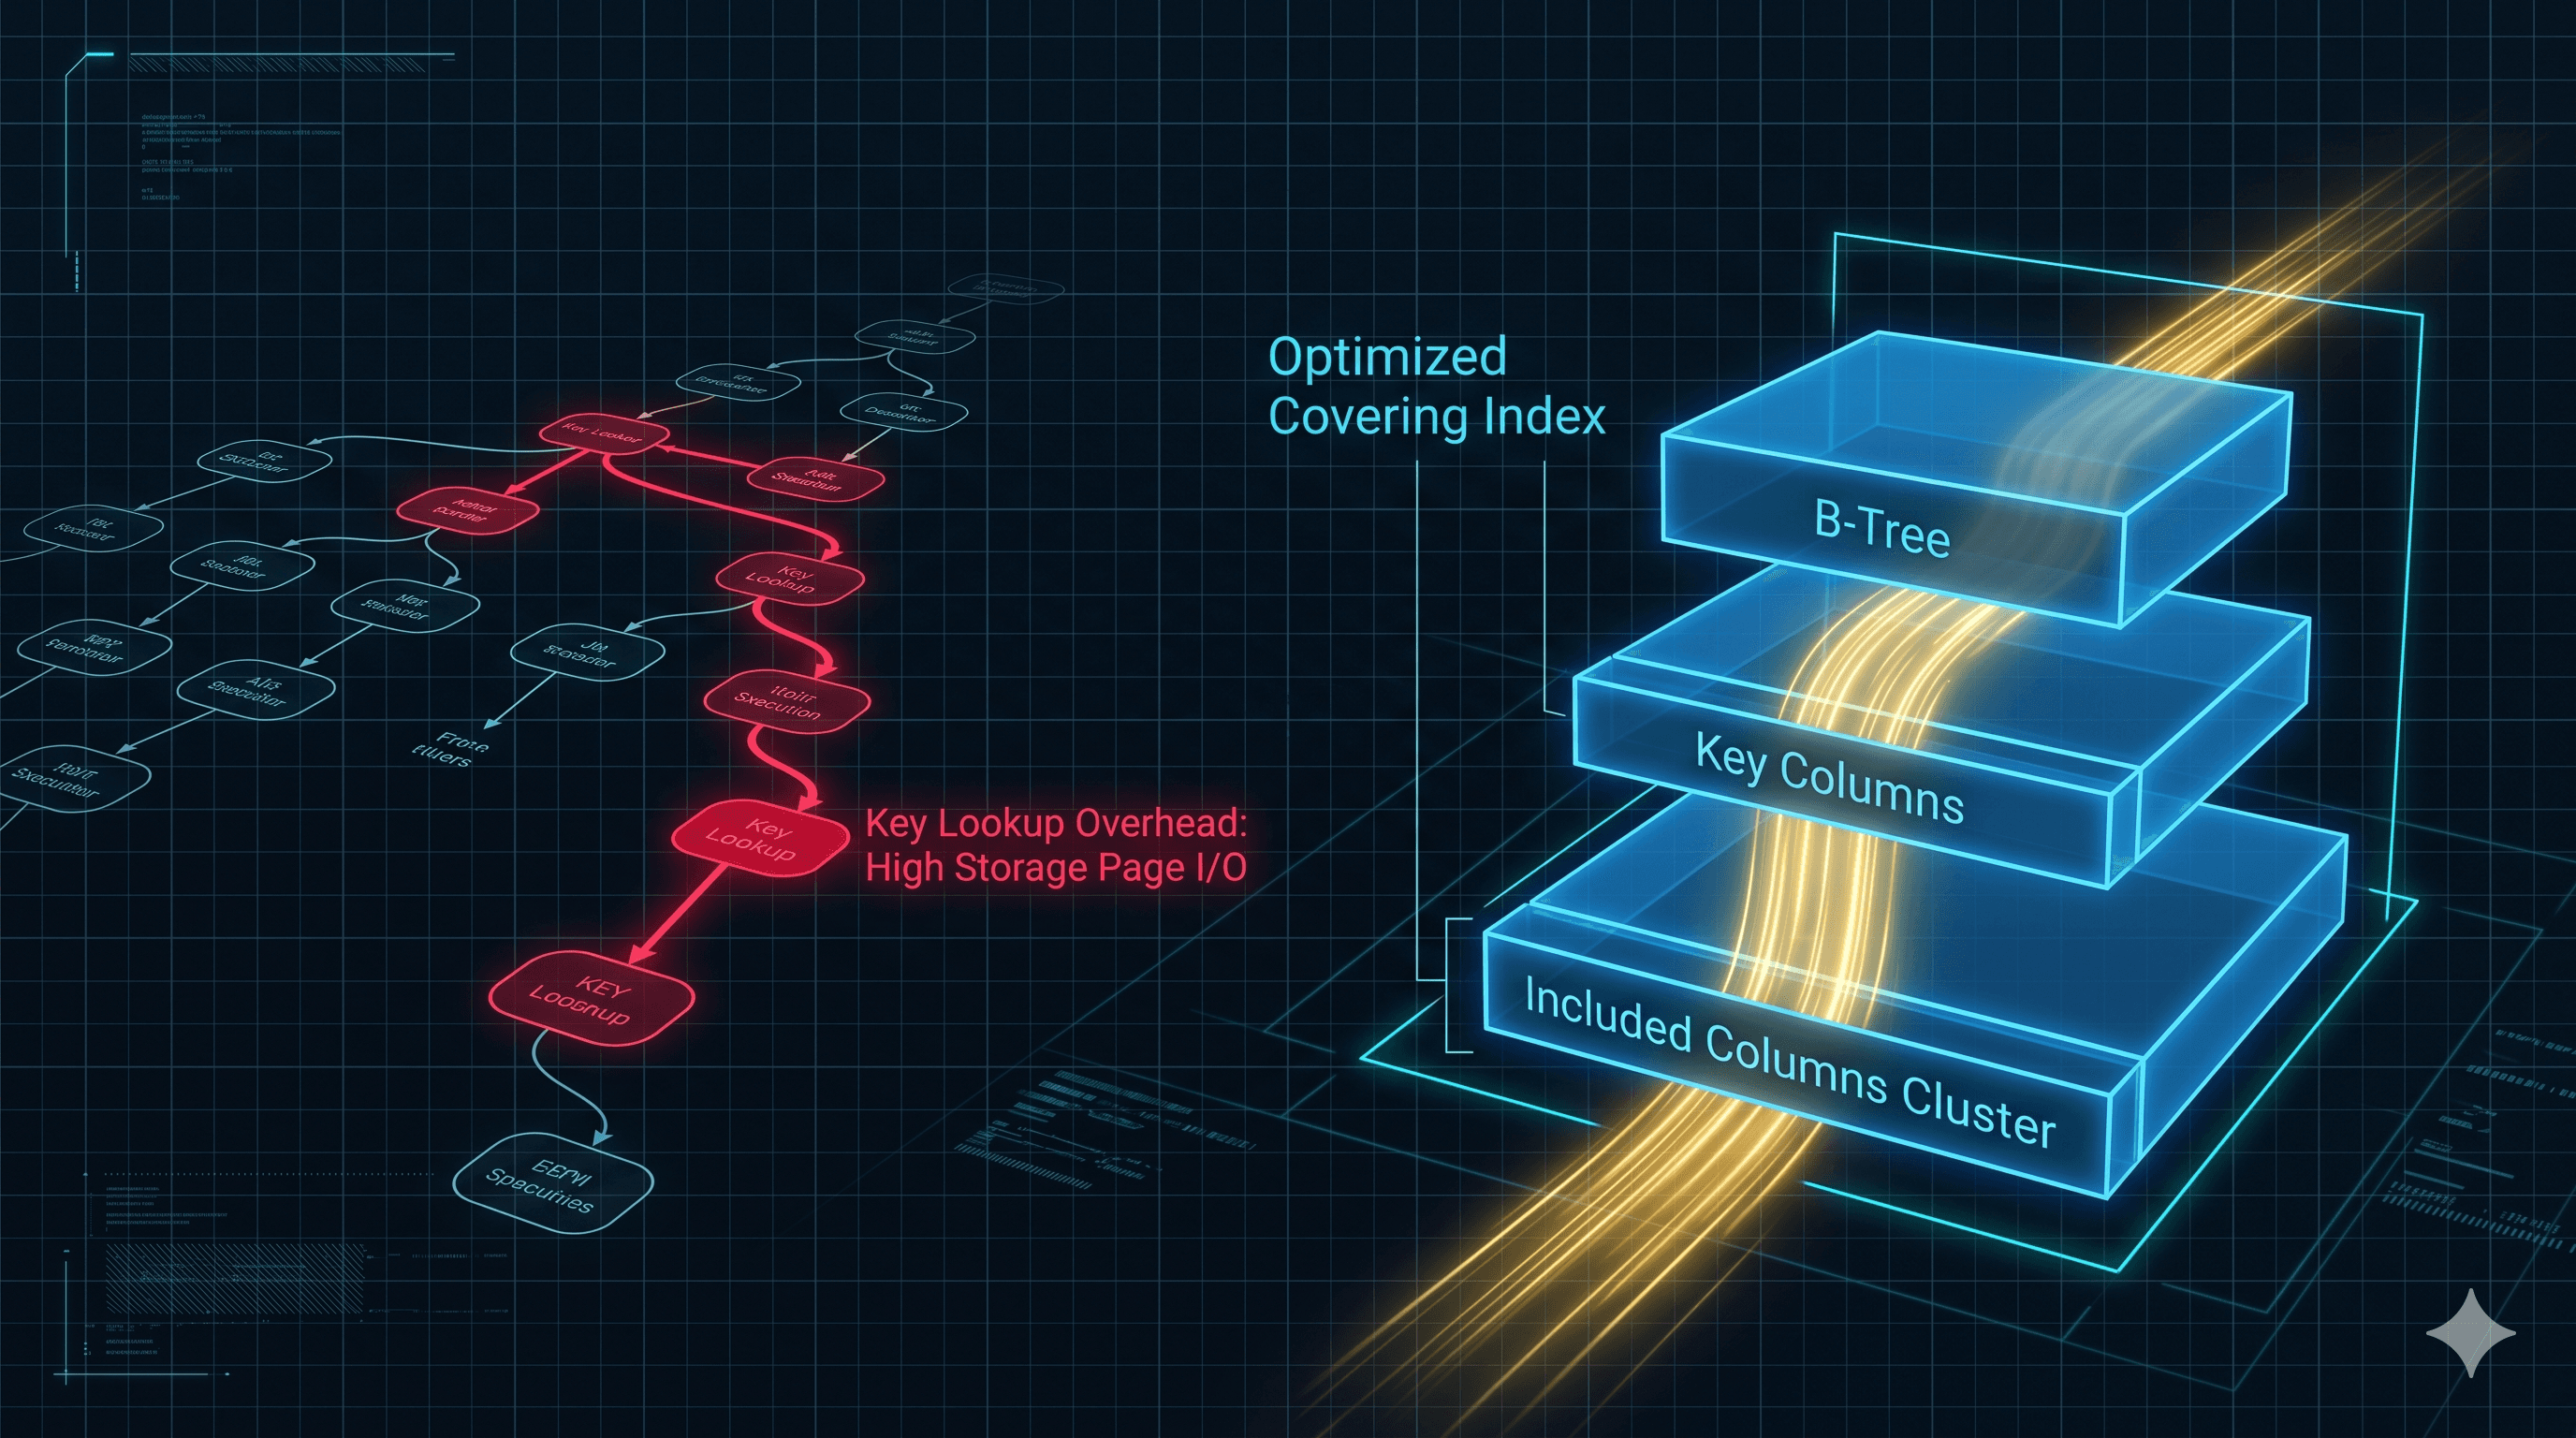
When you write a query containing a filter like WHERE Status = 'Pending', the Query Optimizer looks directly at a specialized metadata blob called a Histogram to guess how many rows will return. If the histogram states there are only 5 pending rows (because it was generated 3 months ago), but your production table currently holds 500,000 pending rows, the optimizer will mistakenly choose a slow Key Lookup or Nested Loops join rather than a fast Hash Match.
5. Diagram 2: The Outdated Statistics Estimation Trap
Understanding how a stale statistical map tricks the optimizer into picking the wrong execution operator prevents junior administrators from misdiagnosing code bugs.

The Diagnostics Script
To find out exactly which tables have stale statistics, leverage the sys.dm_db_stats_properties dynamic management function. This script loops through your tables and reveals how many data rows have been modified since the last time the statistics engine calculated its metrics:
SELECT
    OBJECT_NAME(s.object_id) AS [TableName],
    s.name AS [StatisticName],
    -- The exact timestamp when this map was last updated
    sp.last_updated AS [StatsLastUpdatedTime],
    sp.rows AS [RowsInTableAtLastUpdate],
    -- Tracks every INSERT, UPDATE, and DELETE change made since the update date
    sp.modification_counter AS [RowsModifiedSinceLastUpdate],
    -- Calculate modification saturation percentage
    CAST((CAST(sp.modification_counter AS DECIMAL(18,2)) / NULLIF(sp.rows, 0)) * 100 AS DECIMAL(5,2)) AS [Modification_Percent]
FROM sys.stats s
CROSS APPLY sys.dm_db_stats_properties(s.object_id, s.stats_id) sp
WHERE sp.modification_counter > 500 -- Filters for tables with active transactional changes
ORDER BY [RowsModifiedSinceLastUpdate] DESC;
GO
When are Statistics Considered Outdated?
Legacy Threshold Behavior (Pre-SQL Server 2016): Statistics historically didn't flag as outdated until a massive 20% + 500 rows of your entire table had been completely modified. On a 10-million-row customer table, this meant your statistics could remain completely blind to 1.9 million data row modifications!
Modern Threshold Behavior (SQL Server 2016 through 2025+): The engine defaults to a Dynamic Cardinality Threshold. As your tables grow larger, the required modification percentage automatically shrinks, ensuring that statistics refresh much quicker on high-volume transactional systems.
6. Fixing the System: The Senior Remediation Playbook
When your diagnostics highlight high index fragmentation or large modification counters, deploy targeted T-SQL updates to restore engine efficiency.
Step 1: Execute a Controlled Statistics Update
If your diagnostic script reveals a business-critical table has over 100,000 modifications since its last update timestamp, do not rely on standard automatic updates. Trigger a high-accuracy, full table scan update manually:
-- Manually force a 100% full sample scan calculation over a specific stale statistic
UPDATE STATISTICS dbo.Orders (IX_Orders_CustomerID) WITH FULLSCAN;
GO
Step 2: Leverage the Power of Rebuilds
Executing an ALTER INDEX ... REBUILD on a fragmented index provides a massive hidden benefit: It automatically updates the statistics for that index with a 100% FULLSCAN sample rate simultaneously. ```sql -- Rebuild a major index to clear physical fragmentation and refresh statistics simultaneously
ALTER INDEX IX_Orders_CustomerID ON dbo.Orders REBUILD WITH (ONLINE = ON);
GO
The Senior DBA Operational Warning:** Be strategic with your maintenance schedules. If you run a script that rebuilds every single index and updates every single statistic during the middle of a busy production afternoon, you will lock critical tables, saturate your storage drive's write capabilities, and trigger a massive application outage. Always relegate index rebuilds and intensive stats updates to low-traffic maintenance windows, or utilize ONLINE = ON switches if your instances possess Enterprise-tier licenses.
By keeping your physical indexes tightly aligned and executing targeted statistic updates over highly modified tables, you ensure the Query Optimizer always possesses clear, accurate row metrics, allowing your applications to process complex SELECT query results at maximum speed.
Do you run automated nightly maintenance plans to manage fragmentation constraints, or do you utilize custom open-source tools like Ola Hallengren's scripts? Let's discuss database optimization and index maintenance strategies in the comments below!