If you have ever been tasked with finding out exactly which application queries are causing CPU spikes or disk latency on a production database, you might have instinctively reached for SQL Server Profiler. It is a tool many engineers learn early on because of its straightforward visual interface.
However, running SQL Server Profiler on a live, high-volume production instance is a major operational risk. Profiler is a legacy utility that hooks deeply into the relational engine, intercepting database activity synchronously. If your server is processing thousands of requests per second, Profiler can quickly cause severe execution thread bottlenecks, skyrocketing your CPU usage and potentially stalling application traffic.
To capture workloads safely and efficiently, modern SQL Server versions utilize a built-in, lightweight event-tracking architecture known as Extended Events (XEvents). Let’s explore how Extended Events minimize resource overhead, break down the core engine architecture, and deploy the exact scripts you need to capture and analyze long-running production queries.
1. The Real-World Analogy: Security Guard vs. Toll Booth Camera
To understand why Extended Events are drastically superior to SQL Server Profiler, picture a busy city highway during rush hour traffic.
The Profiler Approach (The Heavy Guard): Imagine a security guard standing in the middle of a lane, physically waving down every single vehicle. The guard forces drivers to roll down their windows, checks their registration, writes their details onto a paper notepad, and then allows them to pass. Traffic instantly backs up for miles because the collection mechanism is slow, manual, and intrusive.
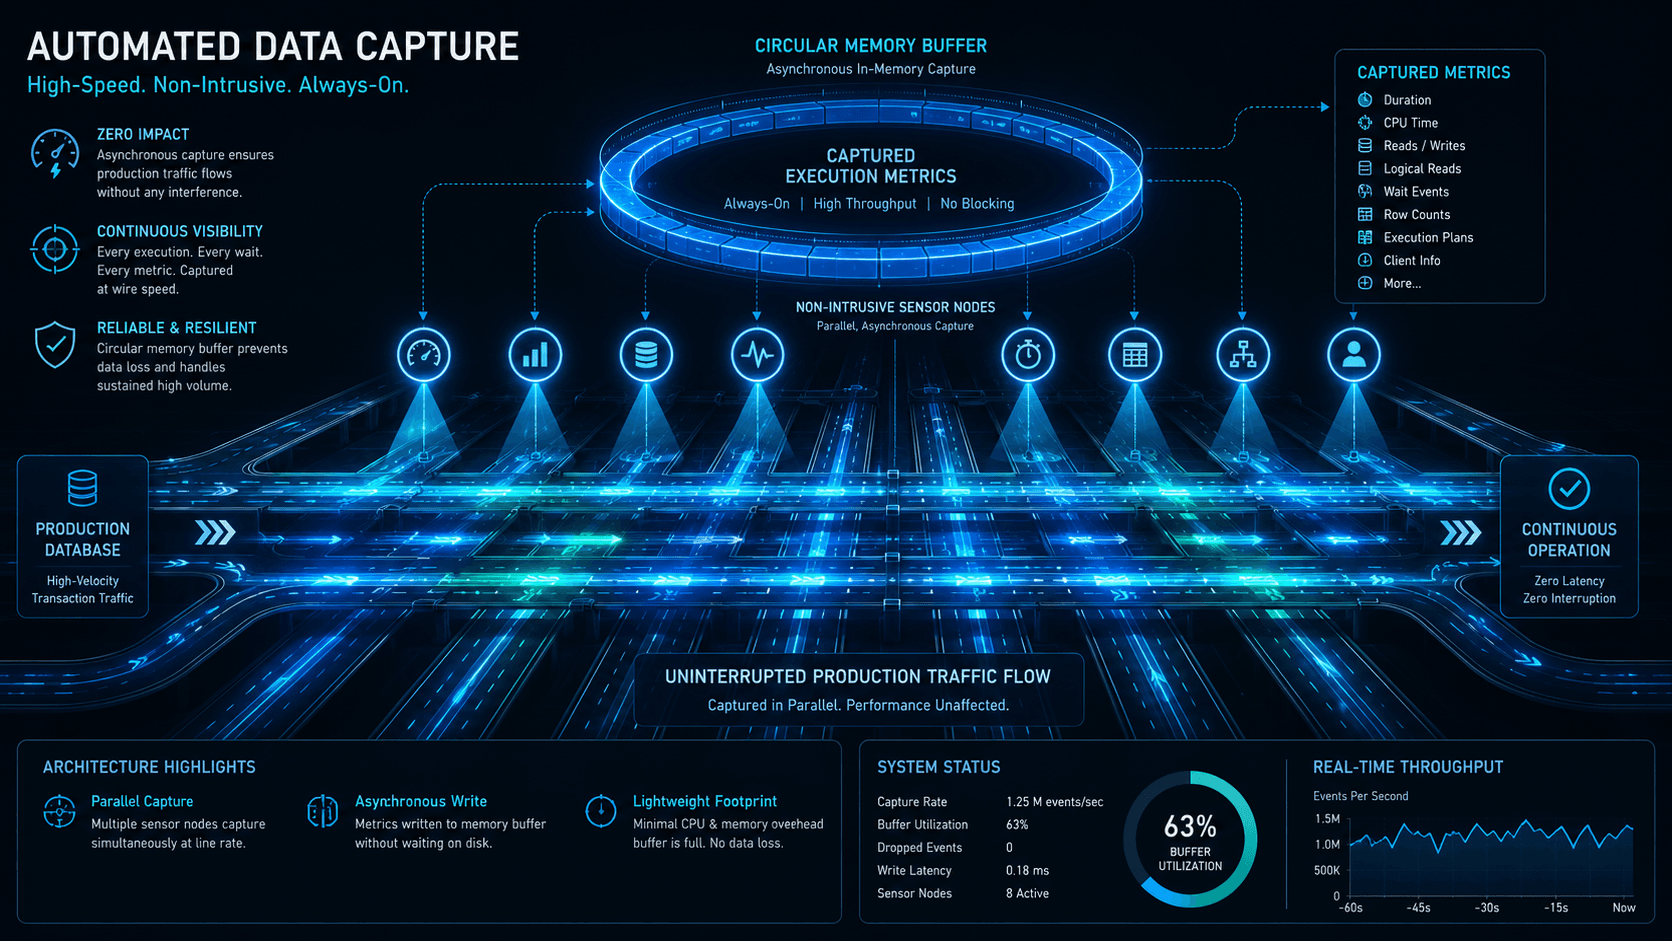
The Extended Events Approach (The Automated Camera): Imagine an electronic toll booth camera mounted cleanly above the highway. As cars zoom past at full speed, the camera flashes photos in the background without forcing anyone to slow down. The photos are temporarily buffered in a quick memory cache and written to an asynchronous log file later.
Extended Events act exactly like that automated camera. They operate entirely in the background with negligible performance overhead.
2. Diagram 1: Profiler Tracking vs. Extended Events Architecture
Visualizing how these two capture models interact with database threads highlights why legacy tracing patterns cause heavy production slowdowns.

3. The Core Anatomy of an Extended Event Session
To build an efficient Extended Event session, you need to understand the four primary building blocks used to construct a trace:
Events: The specific engine actions you want to watch. For tracking query workloads, we look at sql_batch_completed (adhoc T-SQL batches sent by applications) and rpc_completed (Stored Procedures executed via Remote Procedure Calls).
Actions (Global Fields): Additional metadata context pulled at the moment an event fires, such as the database_name, client_hostname, or the username.
Predicates (Filters): The criteria that narrow down your trace data. This is your most powerful tool for reducing overhead. Never capture everything. Set a filter to only capture queries whose execution duration passes a specific threshold.
Targets: The destination where your captured data is written. For persistent analysis, we use the event_file target, which streams events out to high-speed binary .xel files on disk.
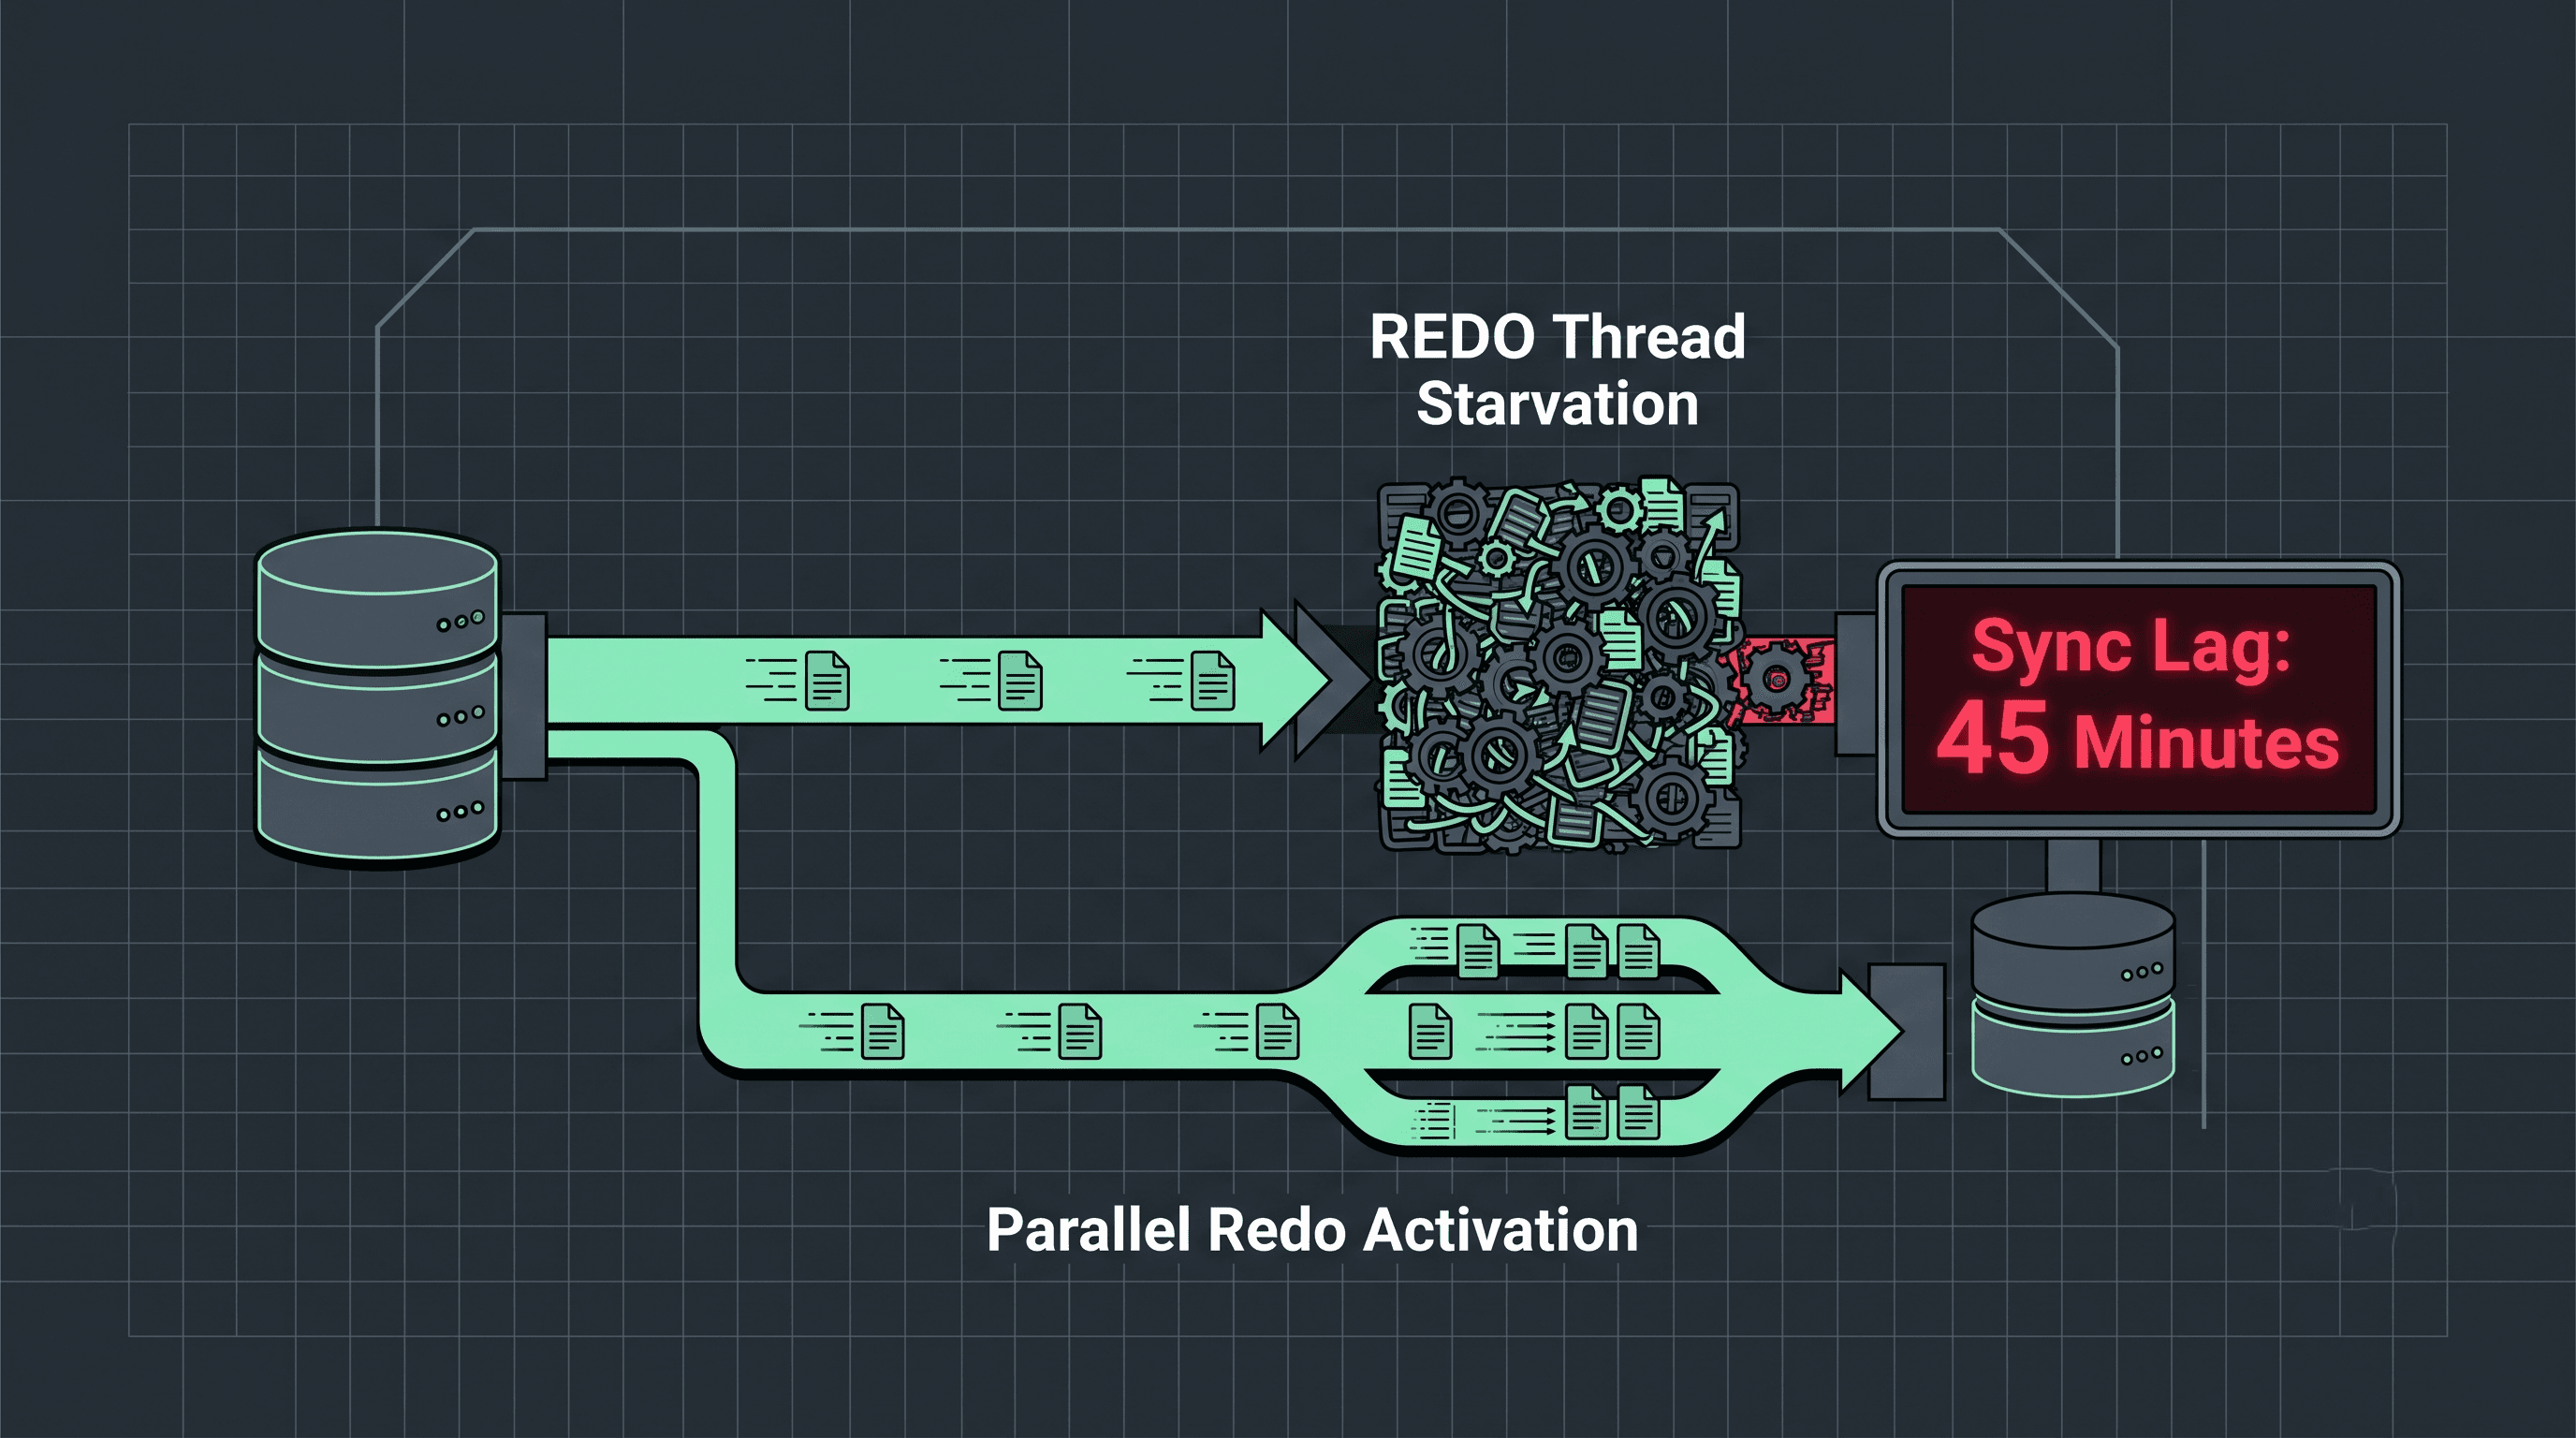
4. Diagram 2: The Extended Events Execution Pipeline
Understanding how events pass through memory buffers before reaching your storage drive ensures your configuration remains safe under sudden I/O spikes.

5. The T-SQL Production Setup Script
This script creates an engine-level Extended Event session designed specifically to capture any adhoc query or stored procedure running against your instance that takes longer than 1 second (1,000,000 microseconds) to execute.
USE master;
GO

-- Step 1: Drop the session if it already exists to prevent duplicate execution errors
IF EXISTS (SELECT * FROM sys.server_event_sessions WHERE name = 'TrackLongRunningQueries')
    DROP EVENT SESSION [TrackLongRunningQueries] ON SERVER;
GO

-- Step 2: Construct the new lightweight event tracking architecture
CREATE EVENT SESSION [TrackLongRunningQueries] ON SERVER
ADD EVENT sqlserver.rpc_completed(
    ACTION(sqlserver.client_hostname, sqlserver.database_name, sqlserver.nt_username, sqlserver.sql_text)
    -- Predicate Note: Duration is tracked in MICROSECONDS (1,000,000 microsec = 1 second)
    WHERE ([duration]>=(1000000))),
ADD EVENT sqlserver.sql_batch_completed(
    ACTION(sqlserver.client_hostname, sqlserver.database_name, sqlserver.nt_username, sqlserver.sql_text)
    WHERE ([duration]>=(1000000)))
ADD TARGET package0.event_file(SET filename=N'C:\DBA_Logs\TrackLongRunningQueries.xel', max_file_size=(50))
WITH (
    MAX_MEMORY=4096 KB,
    EVENT_RETENTION_MODE=ASYNCHRONOUS_BUFFER, -- Protects application performance from I/O pauses
    MAX_DISPATCH_LATENCY=30 SECONDS,
    MAX_EVENT_SIZE=0 KB,
    MEMORY_PARTITION_MODE=NONE,
    TRACK_CAUSALITY=OFF,
    STARTUP_STATE=OFF
);
GO

-- Step 3: Explicitly start the session engine to begin background data capture
ALTER EVENT SESSION [TrackLongRunningQueries] ON SERVER STATE = START;
GO
6. Shredding the Telemetry: How to Read the Capture Data
Extended Events store their tracking data inside high-speed binary .xel files. Because this data is written as structured XML blocks, you cannot read it using a standard select query.
Instead, you must use T-SQL XML shredding functions to parse the binary file array and cast the properties back into clean, scannable relational columns:
-- Read and decode the binary .xel log data into readable relational rows
SELECT
    -- Extract event name type
    event_data_XML.value('(//event/@name)[1]', 'VARCHAR(100)') AS [EventName],
    -- Extract timestamp indicating when the query finished execution
    DATEADD(hour, 5, DATEADD(minute, 30, event_data_XML.value('(//event/@timestamp)[1]', 'DATETIME'))) AS [ExecutionTime_IST],
    -- Extract global action context metrics
    event_data_XML.value('(//event/action[@name="database_name"]/value)[1]', 'SYSNAME') AS [DatabaseName],
    event_data_XML.value('(//event/action[@name="client_hostname"]/value)[1]', 'VARCHAR(100)') AS [ClientHost],
    event_data_XML.value('(//event/action[@name="nt_username"]/value)[1]', 'VARCHAR(100)') AS [ExecutingUser],
    -- Extract underlying query metrics (Duration converted to Milliseconds for easy reading)
    CAST(event_data_XML.value('(//event/data[@name="duration"]/value)[1]', 'BIGINT') / 1000.0 AS DECIMAL(10,2)) AS [Duration_MS],
    event_data_XML.value('(//event/data[@name="cpu_time"]/value)[1]', 'BIGINT') / 1000 AS [CPU_MS],
    event_data_XML.value('(//event/data[@name="physical_reads"]/value)[1]', 'BIGINT') AS [PhysicalReads],
    event_data_XML.value('(//event/action[@name="sql_text"]/value)[1]', 'NVARCHAR(MAX)') AS [SQLText]
FROM (
    SELECT CAST(event_data AS XML) AS event_data_XML
    FROM sys.fn_xe_file_target_read_file('C:\DBA_Logs\TrackLongRunningQueries*.xel', NULL, NULL, NULL)
) AS TargetXMLData
ORDER BY [Duration_MS] DESC;
GO
7. Best Practices for Junior DBAs Managing Traces
To ensure your Extended Event sessions remain completely transparent to your production workload, incorporate these core operational principles:
Never Forget the Predicate: Running an Extended Event session without a filter is just as dangerous as running SQL Server Profiler. If you capture every single microsecond connection query on a busy engine, your memory buffers will overflow and fill your disk drives. Always configure strict thresholds (such as filters on duration, logical_reads, or cpu_time).
Clean Up Completed Sessions: Once you have completed your active optimization or performance audit window, do not leave the trace session running indefinitely. Turn off the execution stream to reclaim memory allocation blocks:
-- Stop the background data tracking engine safely
ALTER EVENT SESSION [TrackLongRunningQueries] ON SERVER STATE = STOP;
GO
- Utilize Asynchronous Buffering: Always ensure your event retention configuration is explicitly set to
ASYNCHRONOUS_BUFFER. This tells the storage engine that if the server experiences a sudden, intense burst of user traffic, it can drop individual trace packets if the disk is busy, prioritizing your application's write transactions over data collection logging.
By replacing legacy profiling traces with lightweight, filtered Extended Event structures, you can safely track execution bottlenecks, resolve production slowdowns, and keep your critical database infrastructure entirely secure and highly performant.
Do you still utilize legacy SQL Server Profiler traces during on-call incidents, or have you transitioned your primary diagnostic checks over to Extended Event sessions? Let's discuss query capture strategies and script tuning in the comments below!