You are a Junior DBA, and you just finished setting up an Extended Events session to capture long-running production queries. You open your capture file and immediately find a massive, resource-heavy statement that is spiking the CPU. You copy the T-SQL text, paste it into SQL Server Management Studio (SSMS), and... now what?
How do you determine why this specific SELECT statement is so slow? Where are the bottlenecks? Is it missing an index? Are the statistics outdated? Is the engine joining tables in the wrong order?
The answer to all these questions lies inside the Graphical Execution Plan.
Think of a Graphical Execution Plan as a delivery driver's GPS route map. The SQL Server Query Optimizer generates this detailed plan before executing any query. It is the exact, step-by-step blueprint illustrating how the engine will navigate through your B-Tree index structures, physical storage pages, and memory buffers to retrieve the results you requested.
Learning how to systematically read this map and decode its sprawling icons is the single most important skill required to master query performance tuning. Let’s break down how to interpret the visual layout, demystify the core icons, and learn how to spot critical bottlenecks on your production instances.
1. The Right-to-Left, Top-to-Bottom Flow Rule
When you view a Graphical Execution Plan in SSMS, you will see a flow chart of icons. It is incredibly common for junior engineers to get overwhelmed by the visual complexity and immediately click the highest percentage number they see or the green "Missing Index" text. Do not do this. It is often a trap.
To read an execution plan with senior-level precision, you must follow the direction of the underlying data stream: You must read from right to left, and from top to bottom.
The icons on the far right (like index scans) are your entry points—they represent the actual physical disk access. Each icon processes data and pushes its output results stream along the connecting arrows to the icon immediately to its left. The final leftmost icon is always the final SELECT result set or DML completion result.
2. Diagram 1: The Blueprint and The Driver
Visualizing the relationship between the high-level T-SQL code, the hidden optimizer, and the visible query plan map simplifies how juniors perceive performance tuning.


3. Demystifying the Core Icons: Your Tuning Vocabulary
Each icon in an execution plan represents a fundamental building block operation inside the storage engine. Here is a dictionary of the most critical icons you will encounter, what they physically mean, and when you should be worried about them.
Data Access Operators (The Disk Intercepts)
These icons reside on the far right of the plan, illustrating how the engine is physically reading your data from storage.
Index Seek: The engine used a direct, efficient navigation path through a non-clustered B-Tree index to pinpoint only the specific range of rows required. This is the database equivalent of jumping straight to the exact page number you need.
Clustered Index Seek: Similar to a standard Index Seek, but executed against the Clustered Index (the underlying table itself). Because the data is stored inside the B-Tree, this is the final destination for reading a full row when you search via the primary key.
Index Scan: The engine was forced to scan every single page of your non-clustered B-Tree index structure. This is generally much heavier on memory buffers than an Index Seek because the engine reads the whole index from start to finish. If you see this on a non-clustered index, you are usually missing a specific index or your query uses a wildcard like LIKE '%text%' which makes seeks structurally impossible.
Clustered Index Scan (or Table Scan): This is the nuclear option. The engine cannot find any index that supports your WHERE clause filter. It is therefore forced to read every single page of your entire underlying table from your storage drive. This operator is extremely disk and CPU heavy on large tables and is the absolute first bottleneck you should resolve.
Data Modification Operators (The Write Path)
These icons illustrate how data is being inserted, updated, or deleted.
Table Insert / Index Insert: The engine is physically writing new data pages and updating all associated B-Tree index structures. These can slow down significantly if your table possesses excessive numbers of fragmented non-clustered indexes, forcing the engine to complete duplicate work.
Table Update: The engine is modifying existing data pages inside a table file.
Logical Processing Operators (The Query Math)
These icons are where data is filtered, sorted, or transformed.
Sort: The engine was explicitly instructed to sort the input results stream, usually due to an ORDER BY clause. Warning: Sorting is a massive, CPU-intensive performance bottleneck. Forcing the engine to stop processing data to sort millions of rows will instantly stall your query. The best solution is often to create an index that already hosts the data pre-sorted in the required order.
Key Lookup (or RID Lookup): The dreaded bottleneck trap. The engine used a non-clustered index seek to find your rows, but your SELECT clause requested additional columns that were not included (covered) by that index B-Tree. The engine is forced to pause, leave the non-clustered index, and execute a second, independent look-up read back against the main clustered index to grab those missing columns. The fix is often to create a "Covering Index" which INCLUDEs those missing columns directly.
Filter: The engine is evaluating a specific predicate expression (like a WHERE, HAVING, or ON clause) and discarding rows that do not match the criteria. A filter often indicates that the engine was forced to read a larger set of data from disk than required because the data was not filtered further up-stream by a seek operator.
Join Operators (The Data Convergers)
SQL Server uses advanced mathematical logic to combine results streams between tables.
Nested Loops (Join): The standard join operator. For every single row it receives from the top (outer) input stream, it searches for a matching row in the bottom (inner) input stream. This operator is lightning-fast when combining small datasets, but it scales poorly if both the input streams are massive.
Hash Match (Join): The heavy-lifting join operator used for massive enterprise tables when no supportive indexes exist. The engine stops the execution stream and builds a temporary "hash map" memory table of the smaller input stream. Warning: Hash matches require a temporary memory buffer grant. If your server runs out of memory and is forced to spill that hash map to TempDB on physical disk, performance will collapse.
4. Visual Operator Cheat Sheet
To help you visually identify all of these operators instantly inside SQL Server Management Studio (SSMS), keep this detailed reference card handy during your triage sessions:

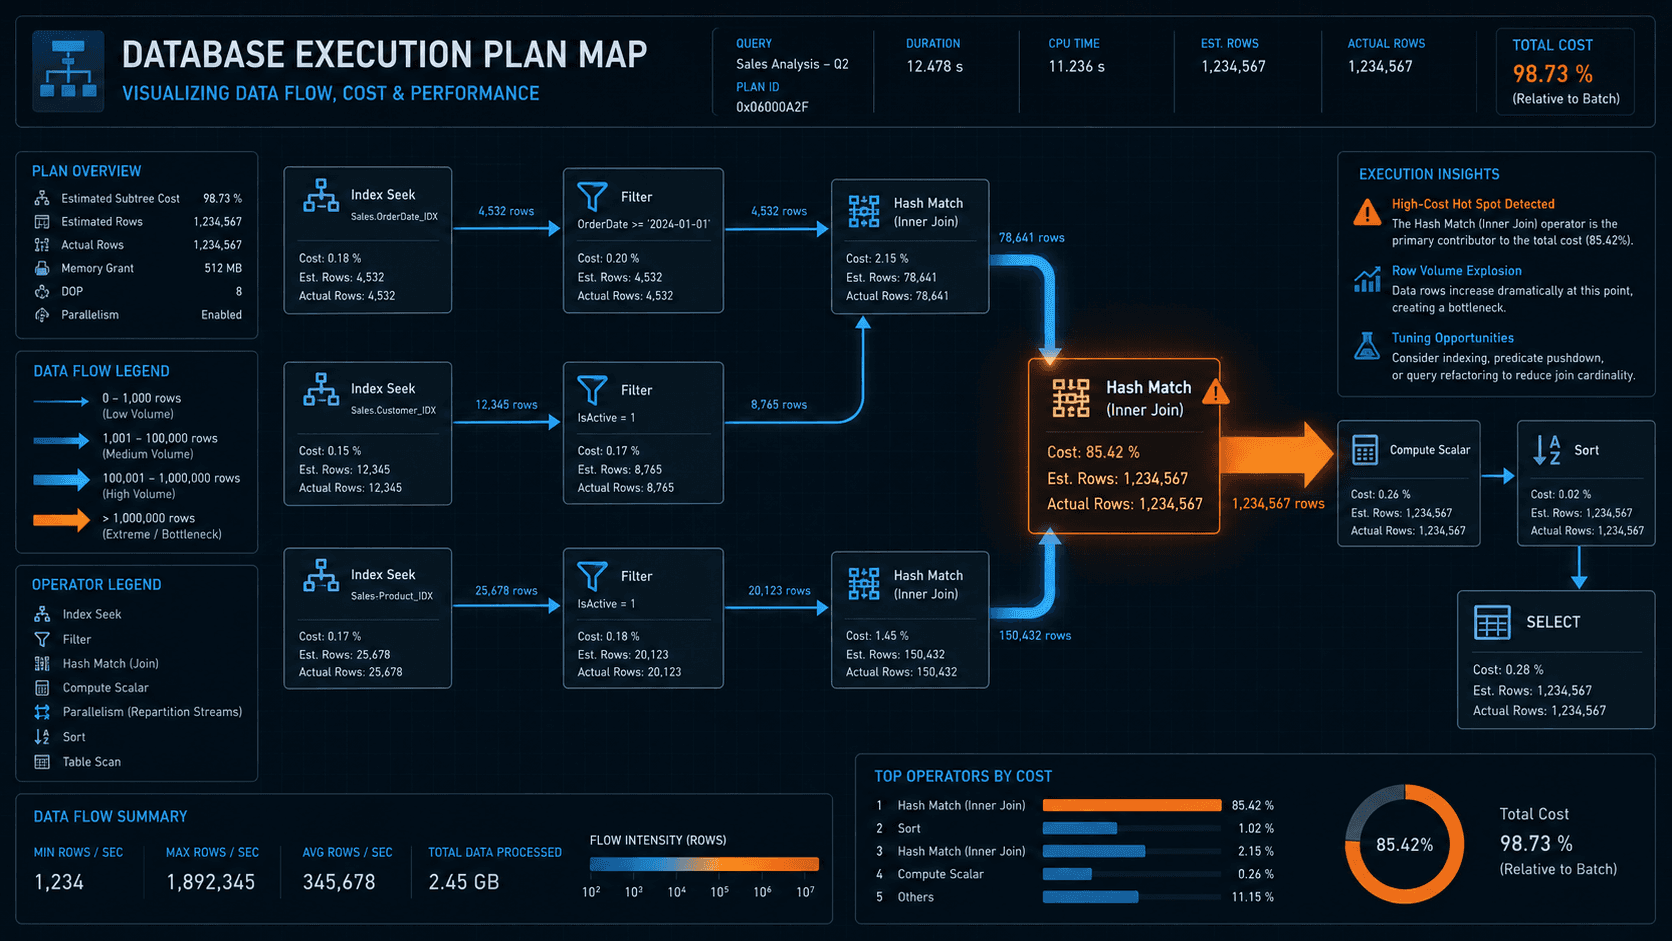
5. Diagram 2: The Critical Arrow Thickness Secrets
As a database professional, the icons only tell half the story. To locate the actual data flow bottleneck, you must master reading the connecting arrows.
SQL Server manages execution plan cost values via percentages of your overall query execution. Junior DBAs often obsess over the operator that has the highest percentage (e.g., 60% on a Hash Match join). However, the engine can easily miscalculate these costs based on outdated statistics.


The absolute best performance signal in an execution plan is the arrow thickness. Arrow thickness visually illustrates the actual volume of data rows flowing between steps:
Thick Arrow: Thousands or millions of rows of data are flowing between steps.
Thin Arrow: Only a handful of rows are flowing.
The Junior DBA "Aha!" Moment
When you follow the plan from right to left, always look for the point where a thick arrow enters an icon (input) and a thin arrow exits the same icon (output). This is exactly where the majority of your CPU, Memory, and Disk resources are being consumed to process, filter, or combine the data. This operator is your query bottleneck—optimize it first.
6. The Golden Rule: Never Blindly Apply Missing Index Hints
When the query optimizer creates a plan, it frequently inserts green text at the top of the execution plan layout labeled: Missing Index (Cost 70%): CREATE NONCLUSTERED INDEX ... ON ...
Do not blindly apply these hints. The query optimizer is a purely analytical, math-based algorithm. It is only looking at how to make that one specific query as fast as mathematically possible. It does not look at the holistic health of your entire database server.
- The Problem: Creating a new non-clustered index can speed up a read query, but every single non-clustered index you create also slows down every write operation (
INSERT, UPDATE, DELETE) executed against that table. If you add a 50GB non-clustered index to speed up a once-per-day reporting query, you can easily hammer your everyday write performance, causing application database lock time-outs for everyone else.
When you see a missing index hint, do not execute the T-SQL. Instead, treat it as a quality suggestion:
Analyze the suggested index columns. Does a similar non-clustered index already exist that you can simply update by INCLUDEing the suggested columns?
Examine the WHERE clause and ORDER BY columns in the slow query. Can you optimize the T-SQL to eliminate the sorting step instead of creating a heavy index graph?
Analyze the overall table health. Is the table fragmented? Are the statistics outdated, forcing a scan where a seek is possible?
By reading execution plans from right to left, top to bottom, focusing on arrow thickness, and demystifying the core operators, you can move beyond guesswork and deploy precise, performance-tested tuning solutions that secure and optimize your production infrastructure environment.
How do you currently resolve Graphical Execution Plan bottlenecks on your primary production environments? Have you encountered problematic Hash Match joins on under-indexed reporting databases? Let's discuss query optimization strategies and script internals in the comments below!