Parameter Sniffing: Why Your Stored Procedures Suddenly Run Slow and How to Fix It
Solving the plan cache guessing game: Why a fast query turns into a slow bottleneck overnight, how to spot execution plan mismatch alerts, and how to stabilize performance safely.
It is one of the most baffling anomalies in database engineering. A stored procedure that has run perfectly for months—completing in less than 50 milliseconds every single time—suddenly spikes your CPU and takes two full minutes to complete. In an effort to fix it, you try running the exact same T-SQL query code manually inside a query window, and to your surprise, it finishes instantly. You clear the plan cache or restart the SQL Server instance, and the stored procedure suddenly starts running fast again.
You think the crisis is over, but a few days later, the exact same query slowdown returns without warning.
Your database is suffering from an optimization conflict known as Parameter Sniffing. This is not a bug or a hardware failure; it is a side effect of how SQL Server tries to save time by reusing execution plans. Let's look at why parameter sniffing happens in plain language, how it creates massive performance drops, and how to fix your stored procedures so they stay consistently fast.
1. The Real-World Analogy: Packing a Suitcase for the Wrong Weather
To understand parameter sniffing, look at how an administrative assistant plans travel logistics for an international corporate executive using two different packing strategies.
The First Trip (The Winter Coat Plan): In January, the executive travels to a freezing winter destination in Siberia. The assistant builds a packing list: a heavy wool coat, thick snow boots, and thermal gloves. They save this list in their filing cabinet (The Plan Cache). The trip goes perfectly because the gear matches the weather.
The Plan Reuse Trap (The Tropical Heat Wave): In July, the executive books an urgent trip to a tropical beach resort. Instead of looking at the new location, the assistant blindly pulls the saved list out of the cabinet. They pack the heavy wool coat and snow boots into the suitcase.
The Performance Crash: The executive arrives at the beach, opens the suitcase, and is forced to wear a giant winter coat in 100°F weather. They sweat, get exhausted, and move incredibly slow because the packing plan was built for an entirely different volume of cold weather.
In SQL Server, parameter sniffing means the engine builds an execution plan based on the first parameter value it sees, and then blindly forces subsequent, completely different data volumes to use that exact same plan.
2. The Mechanics: How Fast Plans Turn Into System Bottlenecks
When you execute a stored procedure for the very first time, SQL Server reads the input parameter you passed and checks its index statistics to see how many rows match that value. It then builds a customized map—called an Execution Plan—and stores it in memory so it doesn't have to waste time recalculating it next time.
This introduces a dangerous dependency based on execution order:
The Uncommon Value Run: Imagine a table containing 1,000,000 active orders. Only 5 of those orders belong to "Customer A," while 900,000 belong to "Customer B." If a user executes the stored procedure for Customer A first, the engine checks statistics, realizes only 5 rows match, and builds a lightning-fast Index Seek plan.
The Massive Spill: A few minutes later, a user calls the exact same stored procedure for Customer B. Instead of recalculating the plan, SQL Server reuses the cached plan built for Customer A. It tries to pull 900,000 rows using a microscopic index seek path. This triggers millions of internal logical page reads, saturates your disk I/O, and causes the query to spin indefinitely.
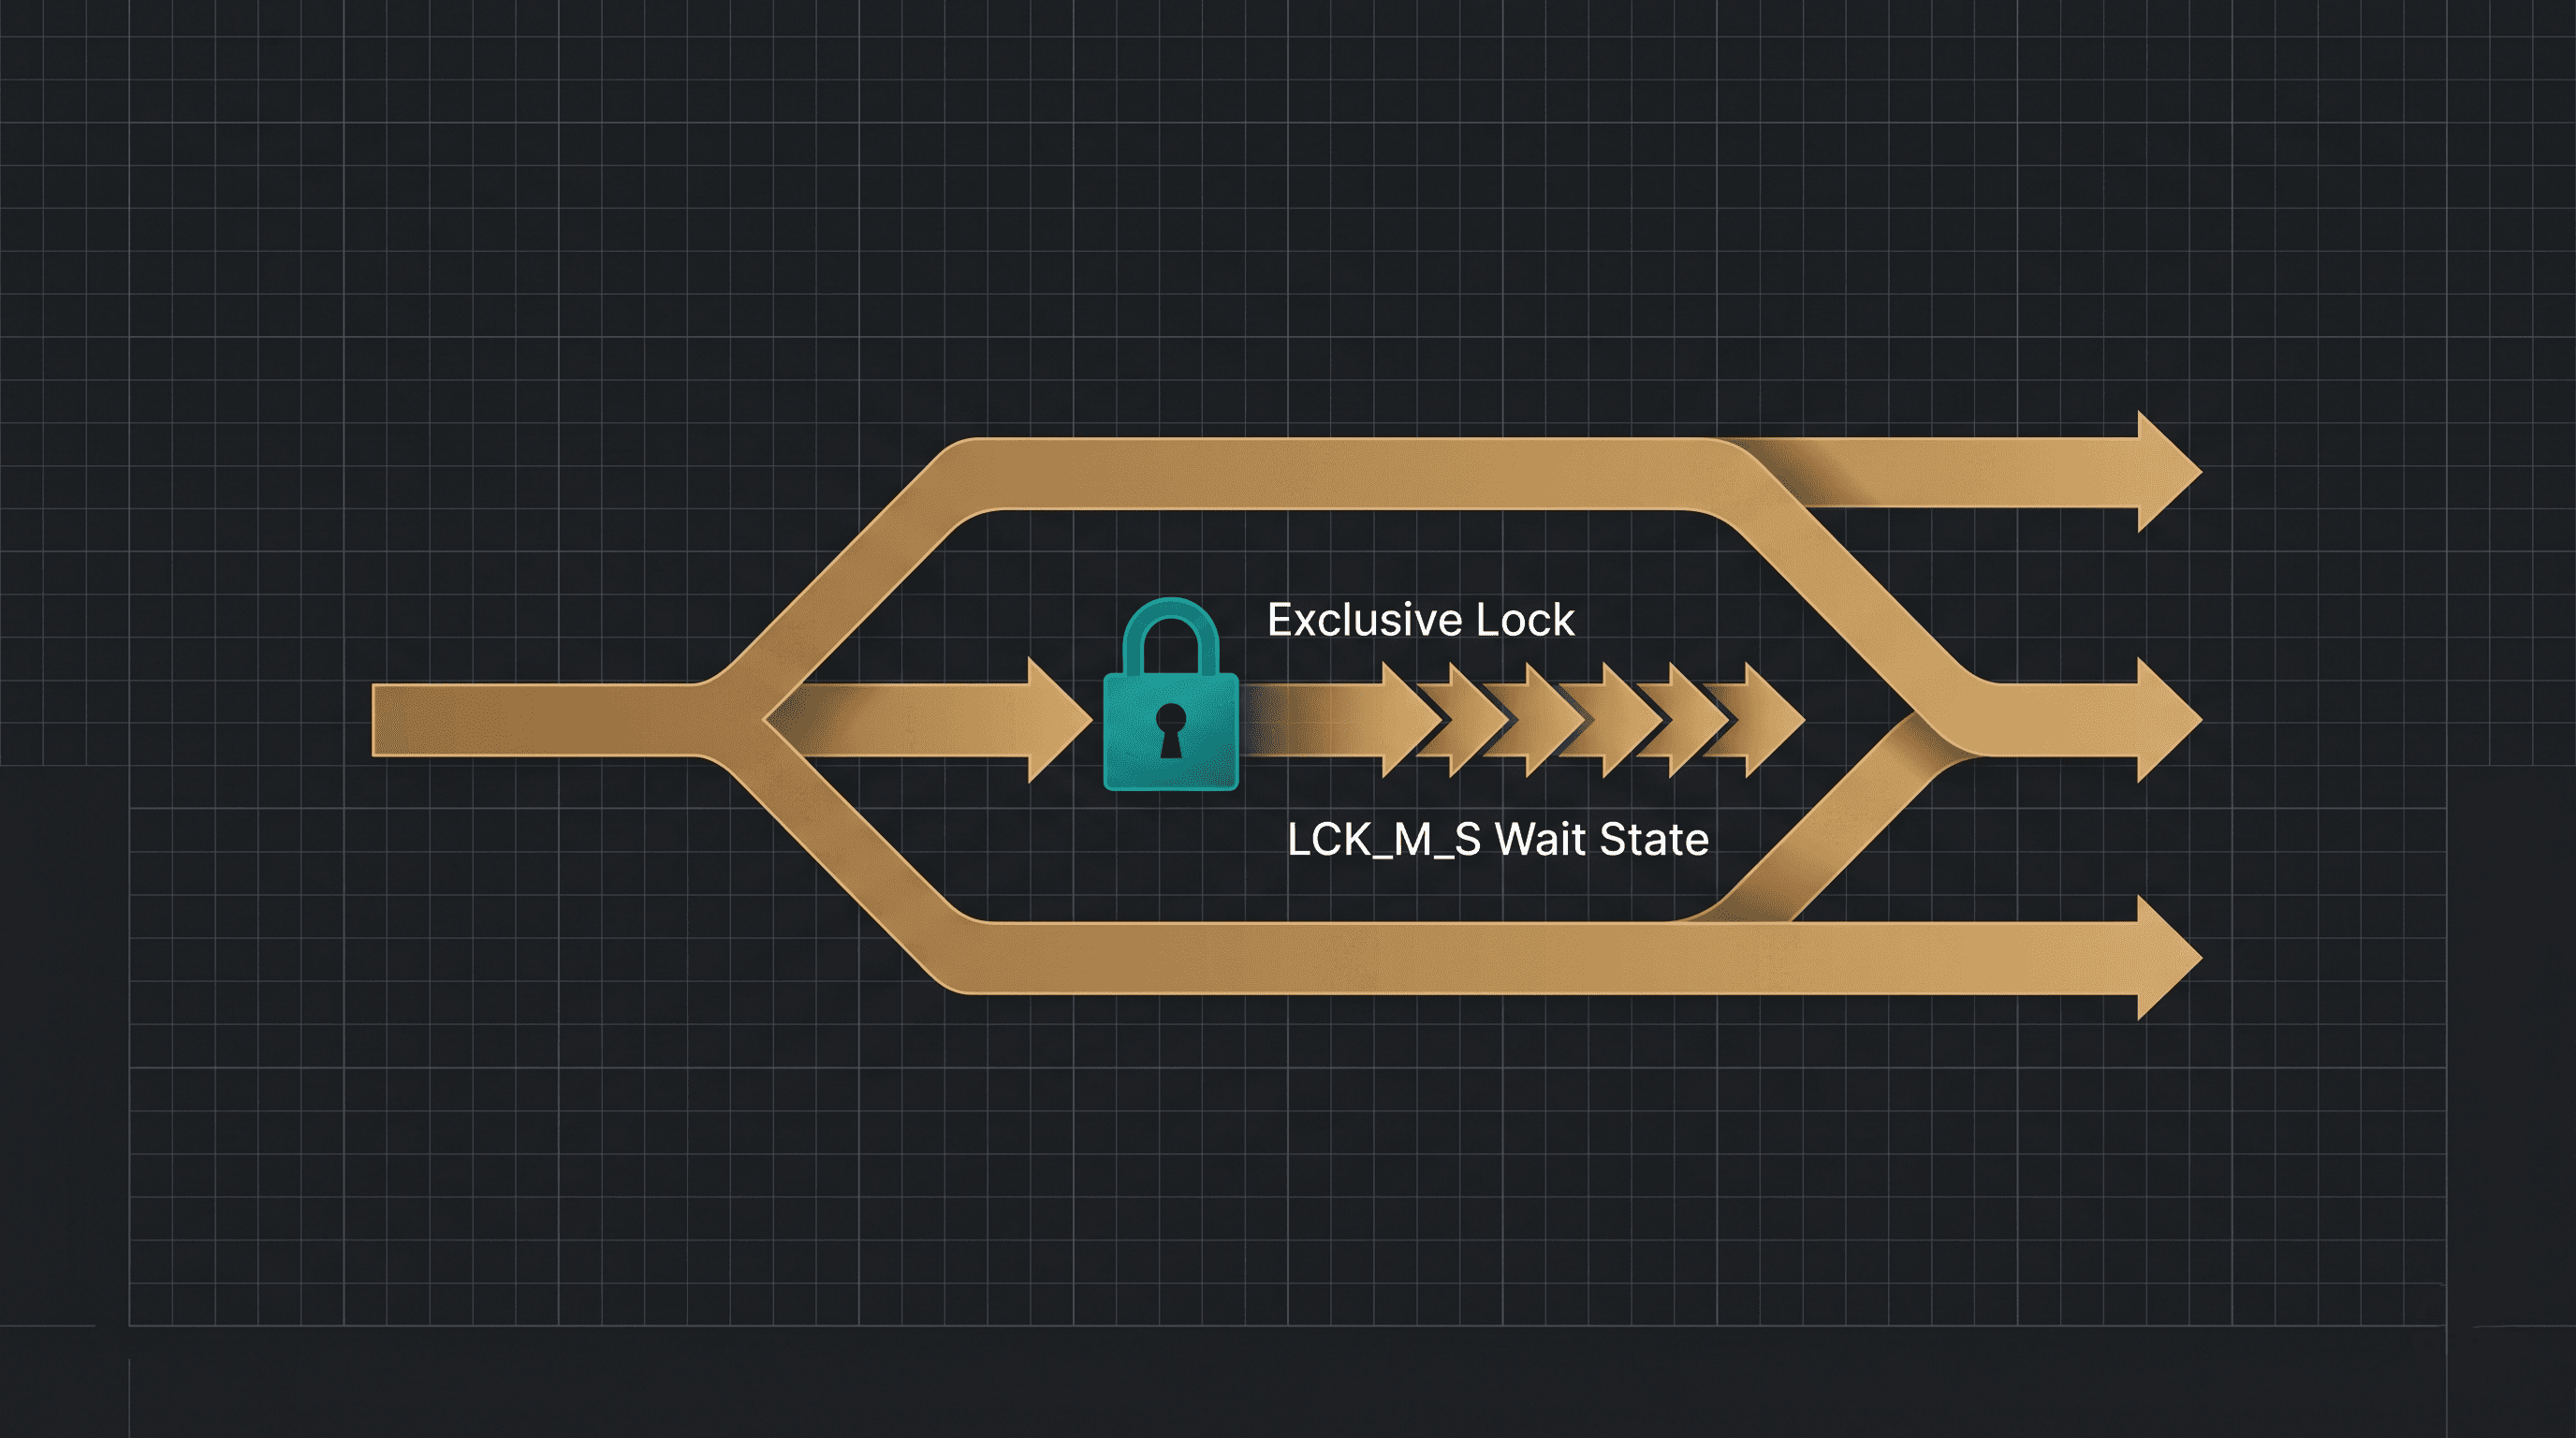
3. Diagram 1: The Plan Cache Optimization Trapped Pathway
This diagram highlights how a plan built for a tiny lookup causes massive performance bottlenecks when reused for a high-volume data set.

4. Live Triage: Finding Unstable Stored Procedures in Memory
When your application suffers from sudden, intermittent query drops, you can query your server's plan cache to locate the exact stored procedures that are experiencing high variance between their fast runs and their slow runs.
Run this plain-language diagnostic script to find your parameter-sniffing bottlenecks:
SELECT TOP 10
    d.name AS [DatabaseName],
    object_name(ps.object_id, ps.database_id) AS [StoredProcedure_Name],
    ps.execution_count AS [Total_Executions],
    -- View the absolute fastest run time in clean milliseconds
    ps.min_worker_time / 1000 AS [Best_Run_CPU_MS],
    -- View the absolute worst run time in clean milliseconds
    ps.max_worker_time / 1000 AS [Worst_Run_CPU_MS],
    -- Calculate the variance multiplier (High multiplier = High instability)
    (ps.max_worker_time / NULLIF(ps.min_worker_time, 0)) AS [Performance_Variance_Multiplier]
FROM sys.dm_exec_procedure_stats ps
JOIN sys.databases d ON ps.database_id = d.database_id
WHERE ps.execution_count > 5
ORDER BY [Performance_Variance_Multiplier] DESC;
GO
If this script highlights procedures where the Worst_Run_CPU_MS is thousands of times higher than the Best_Run_CPU_MS, you have successfully isolated a classic parameter sniffing vulnerability.
5. How to Fix Parameter Sniffing Safely
Resolving plan cache instability requires telling SQL Server when it should reuse an existing plan and when it must build a new path from scratch.
Strategy A: Deploy the OPTIMIZE FOR UNKNOWN Hint (Best Balanced Option)
Instead of forcing the engine to compile a new plan on every execution, you can add a hint to the bottom of your query instructing the optimizer to ignore the specific input value and build a balanced, stable plan based on average table statistics instead:
CREATE PROCEDURE dbo.GetCustomerOrders
    @CustomerID INT
AS
BEGIN
    SELECT OrderID, OrderDate, TotalAmount
    FROM dbo.Orders
    WHERE CustomerID = @CustomerID
    -- Forces the engine to build a highly stable plan based on statistical averages
    OPTION (OPTIMIZE FOR (@CustomerID UNKNOWN));
END;
GO
Strategy B: Force Recompilation for Highly Volatile Queries
If a query handles data that changes dramatically on every execution—and you truly want a custom plan calculated fresh every time—add the RECOMPILE hint. This forces the engine to discard the cache and build a customized plan on every single execution:
CREATE PROCEDURE dbo.GetGlobalReport
    @RegionCode VARCHAR(10)
AS
BEGIN
    SELECT TransactionID, ReportData
    FROM dbo.GlobalSales
    WHERE RegionCode = @RegionCode
    -- Discards the cache and builds a perfect, customized plan every single run
    OPTION (RECOMPILE);
END;
GO
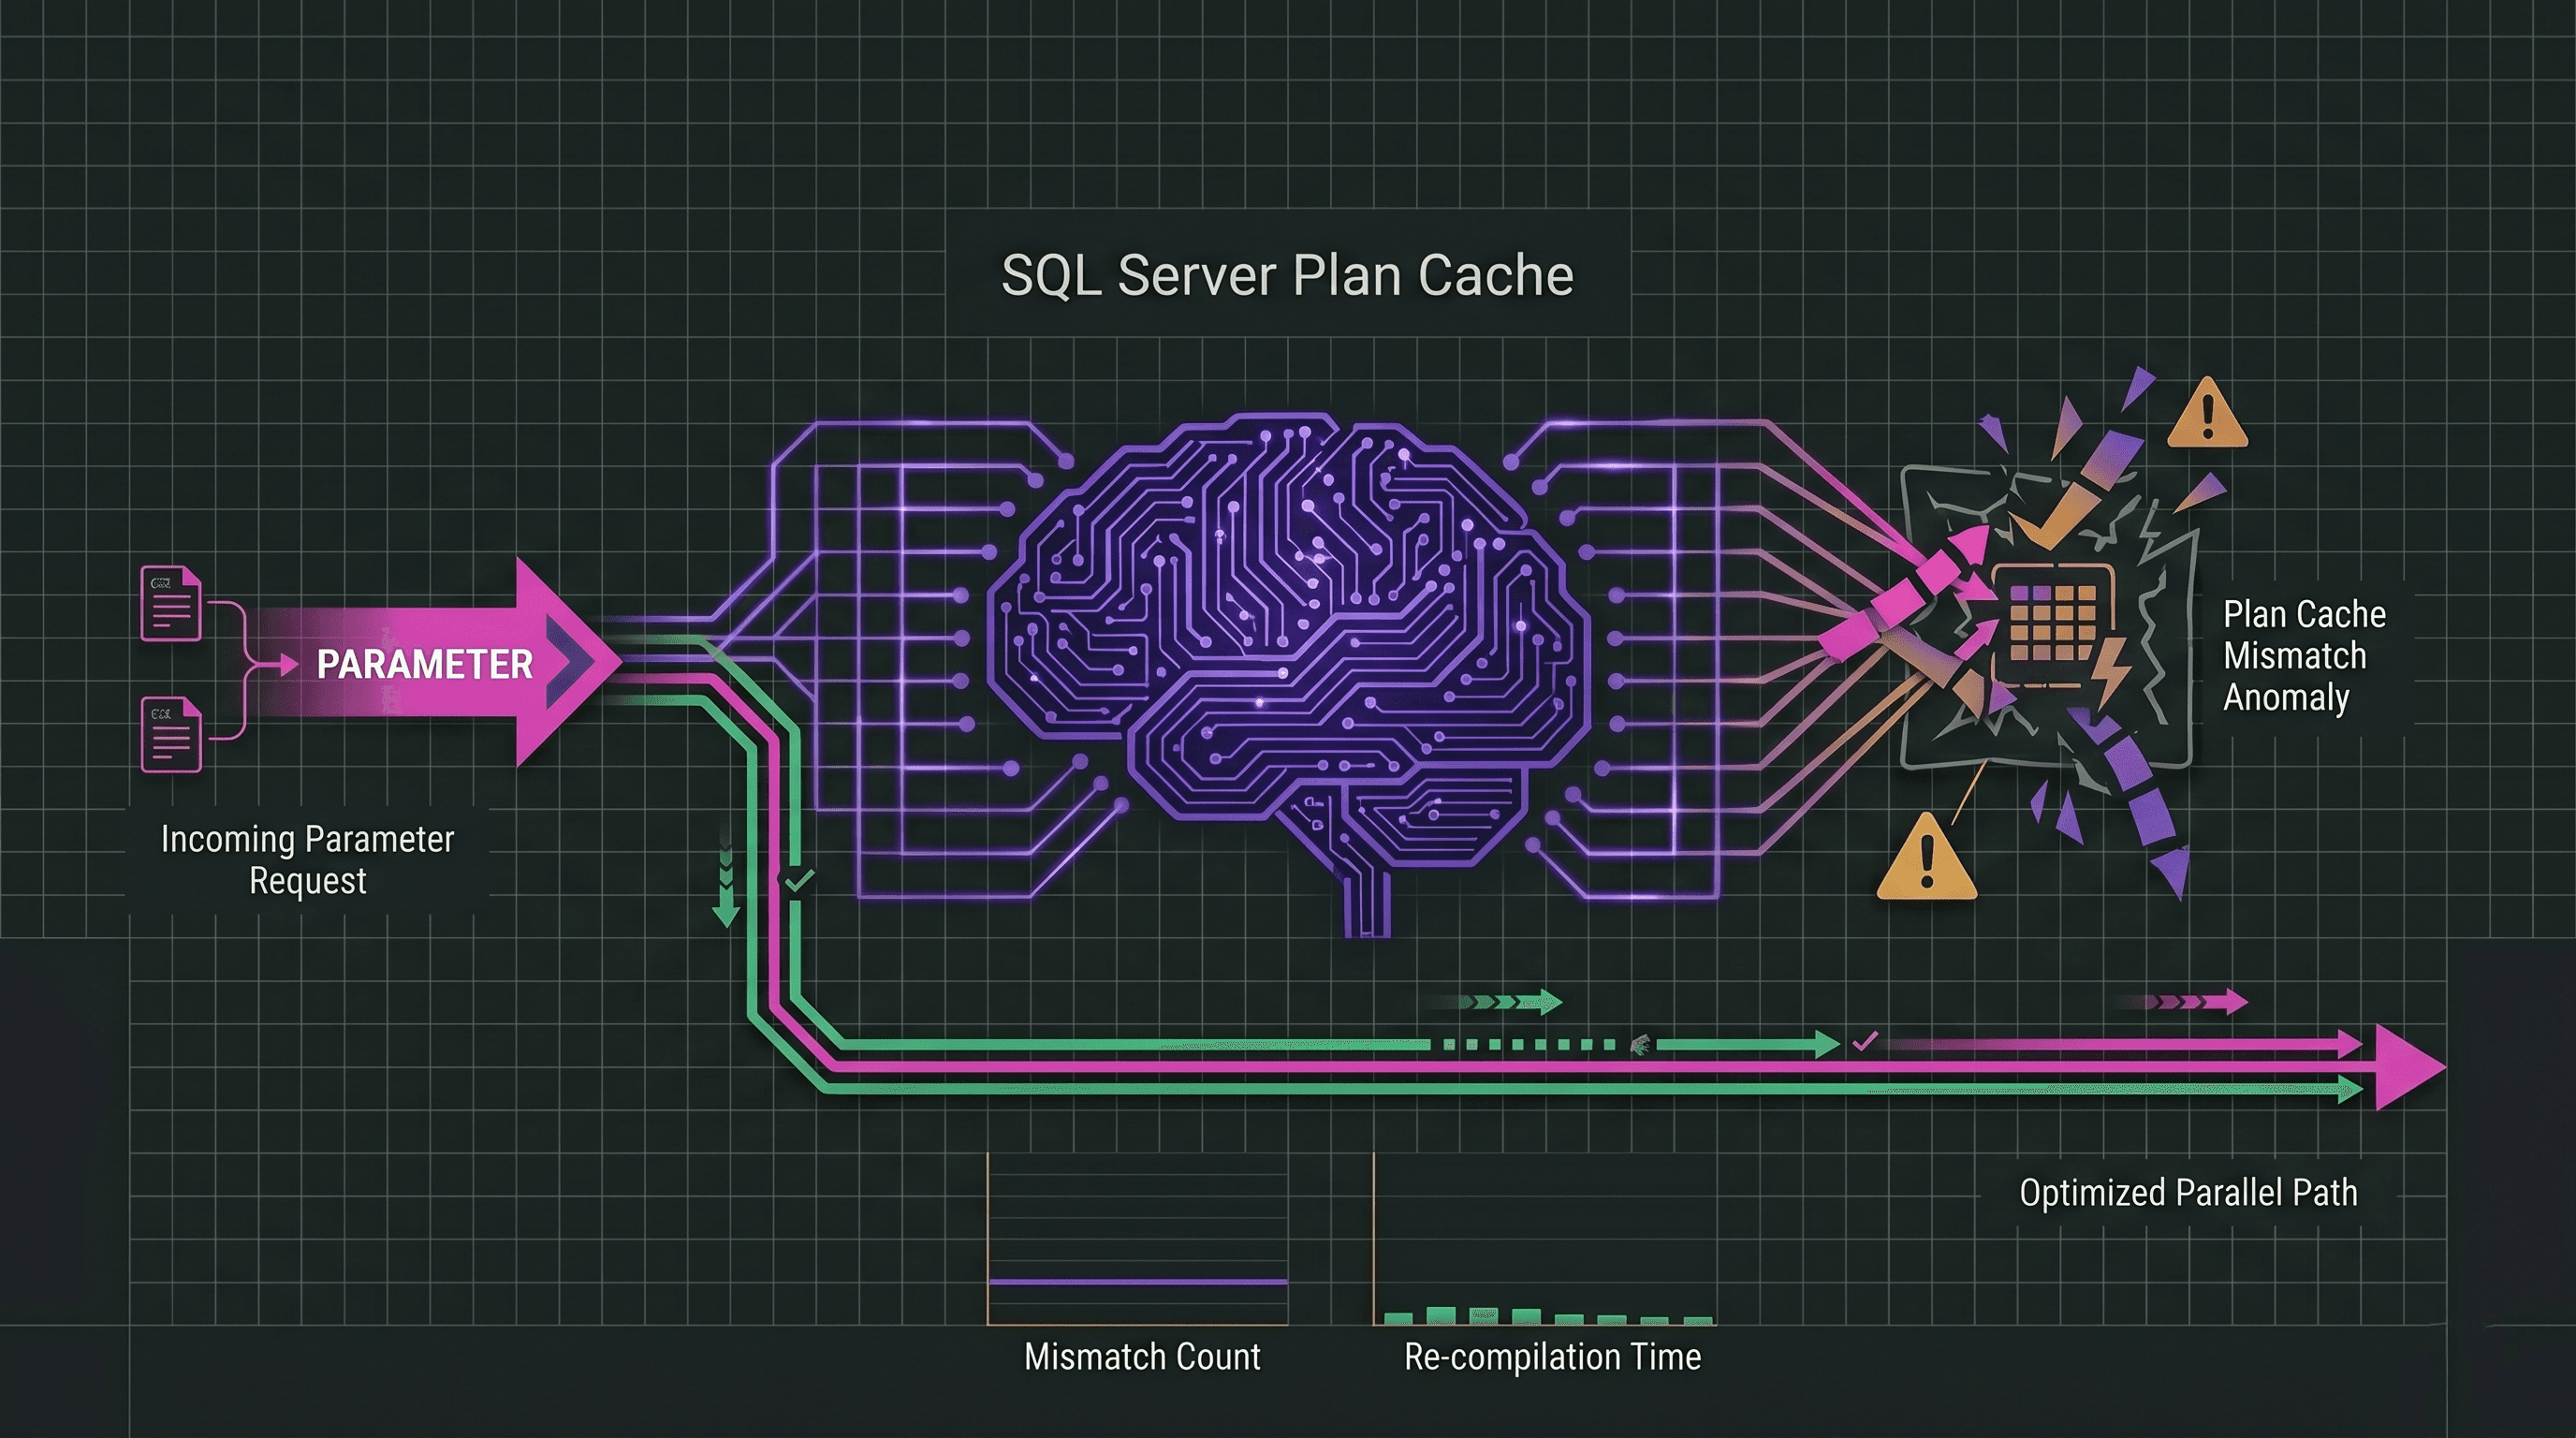
6. The Ultimate SQL Server Parameter Sniffing & Plan Cache Cheat Sheet
For quick reference during a sudden database performance crash or application slowdown, utilize this comprehensive multi-panel architecture dashboard to analyse plan cache variations, stabilize query memory paths, and protect your execution pipelines.

Have you ever had a stored procedure suddenly grind your entire application grid to a halt due to a bad cached plan? Did you resolve the performance drop using an explicit query hint or a local variable workaround? Let's talk plan cache stabilization and performance tuning tips in the comments below!