Deploying a multi-node SQL Server AlwaysOn Availability Group (AG) is the gold standard for achieving high availability and robust disaster recovery across enterprise infrastructure tiers. However, constructing the architecture is only half the battle. The true engineering challenge surfaces when monitoring telemetry indicates that your secondary replicas are lagging drastically behind the primary production node.
When data synchronization lag spikes, your Recovery Point Objective (RPO) and Recovery Time Objective (RTO) boundaries break down. If a catastrophic hardware failure strikes your primary data center while a secondary replica is trapped behind a multi-gigabyte data backlog, a failover will result in irreversible data loss or prolonged application downtime.
To maintain a resilient high-availability topology, you cannot treat data synchronization as a simple background process. You must master the physical mechanics of the log transport pipeline, identify the performance boundaries of synchronous vs. asynchronous replication, and eliminate the thread bottlenecks that stall data hardening.
1. The Real-World Analogy: The Multi-Site Office Blueprint Courier
To conceptualize distributed availability structures across all technical tiers, picture a high-velocity architectural firm operating a primary design headquarters (The Primary DC) and a secondary branch office across the country (The Secondary DR Node).
The Primary Changes (The Active Transactions): Architects at headquarters are continually updating blueprints. Every structural change must be perfectly mirrored at the branch office so both teams remain aligned.
The Log Transport Pipeline (The Blueprint Courier): Instead of shipping full completed blueprints over the wire every minute, a dedicated assistant makes photocopies of individual trace line updates, rolls them into secure shipping tubes (Transaction Log Blocks), and hands them to a high-speed cross-country courier service (The Network Layer).
The Secondary Application (The Local Drafter): When the courier arrives at the branch office, they dump the shipping tubes onto a intake table (The Log Receive Queue). A local drafter (The REDO Thread) must physically open every tube, read the modification lines, and manually apply those precise strokes to the branch office's physical blueprints.
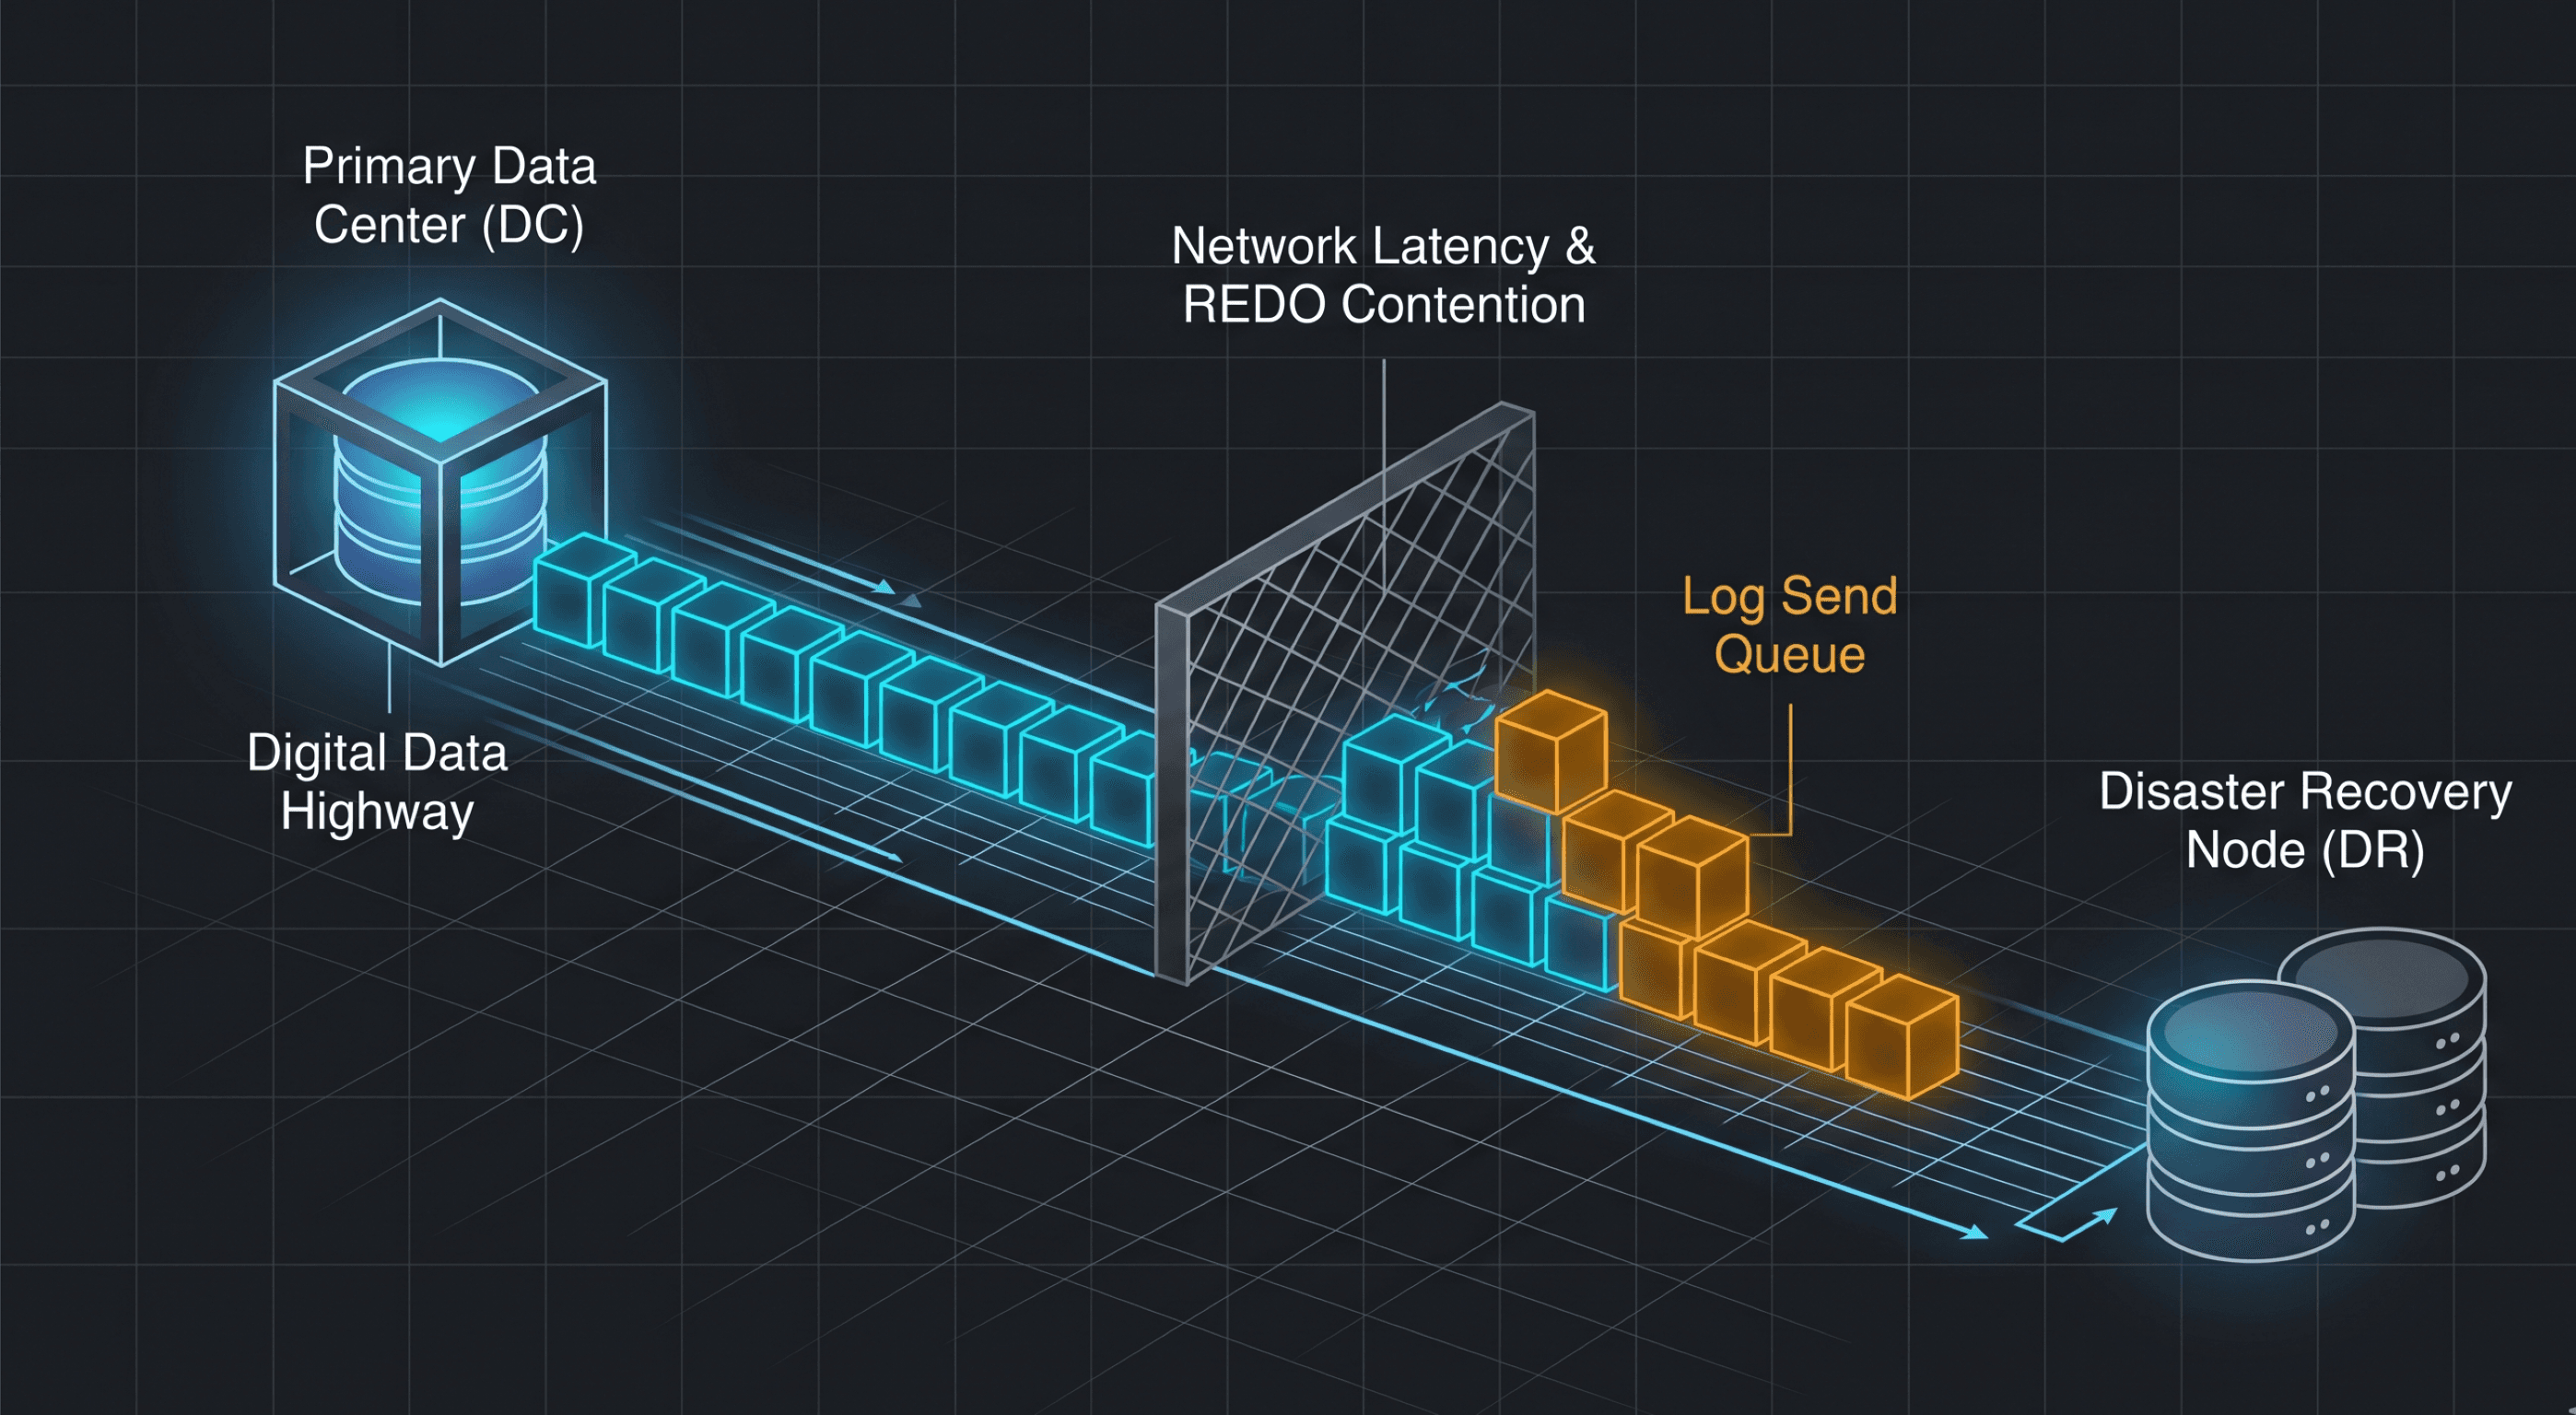
The Sync Lag Failure Points: Synchronization breaks down in two distinct ways:
Log Send Lag: The cross-country courier hits a traffic gridlock on the highway (Network Latency or I/O Bottlenecks), causing a massive pile of tubes to sit backed up at the primary loading dock.
Redo Lag: The courier delivers the tubes instantly, but the single local drafter at the branch office gets completely overwhelmed by the sheer volume of work, causing unread tubes to pile up on the intake counter while the secondary blueprints fall hours out of date.
2. Inside the Pipeline: The Four Phases of AG Replication
Every transaction executed on an AlwaysOn primary database must successfully navigate a highly coordinated four-phase transport pipeline before it is recognized as safe on a secondary target replica:
Log Capture: The transactions are committed on the primary instance, and log blocks are extracted directly from the log write buffers or physical .ldf files.
Log Send: The primary data center's networking layer encapsulates these blocks into TCP packets and pushes them over the network interface to the secondary target node via the dedicated database mirroring endpoint (typically port 5022).
Log Harden: The secondary replica receives the network packets and writes them directly to its local storage subsystem’s transaction log disk. Once written to disk, the log block is considered hardened.
Log Redo: The secondary replica’s internal engine boots up dedicated REDO Threads to read those hardened log pages sequentially, executing the transactions inside the secondary database memory spaces to bring the tables up to date.
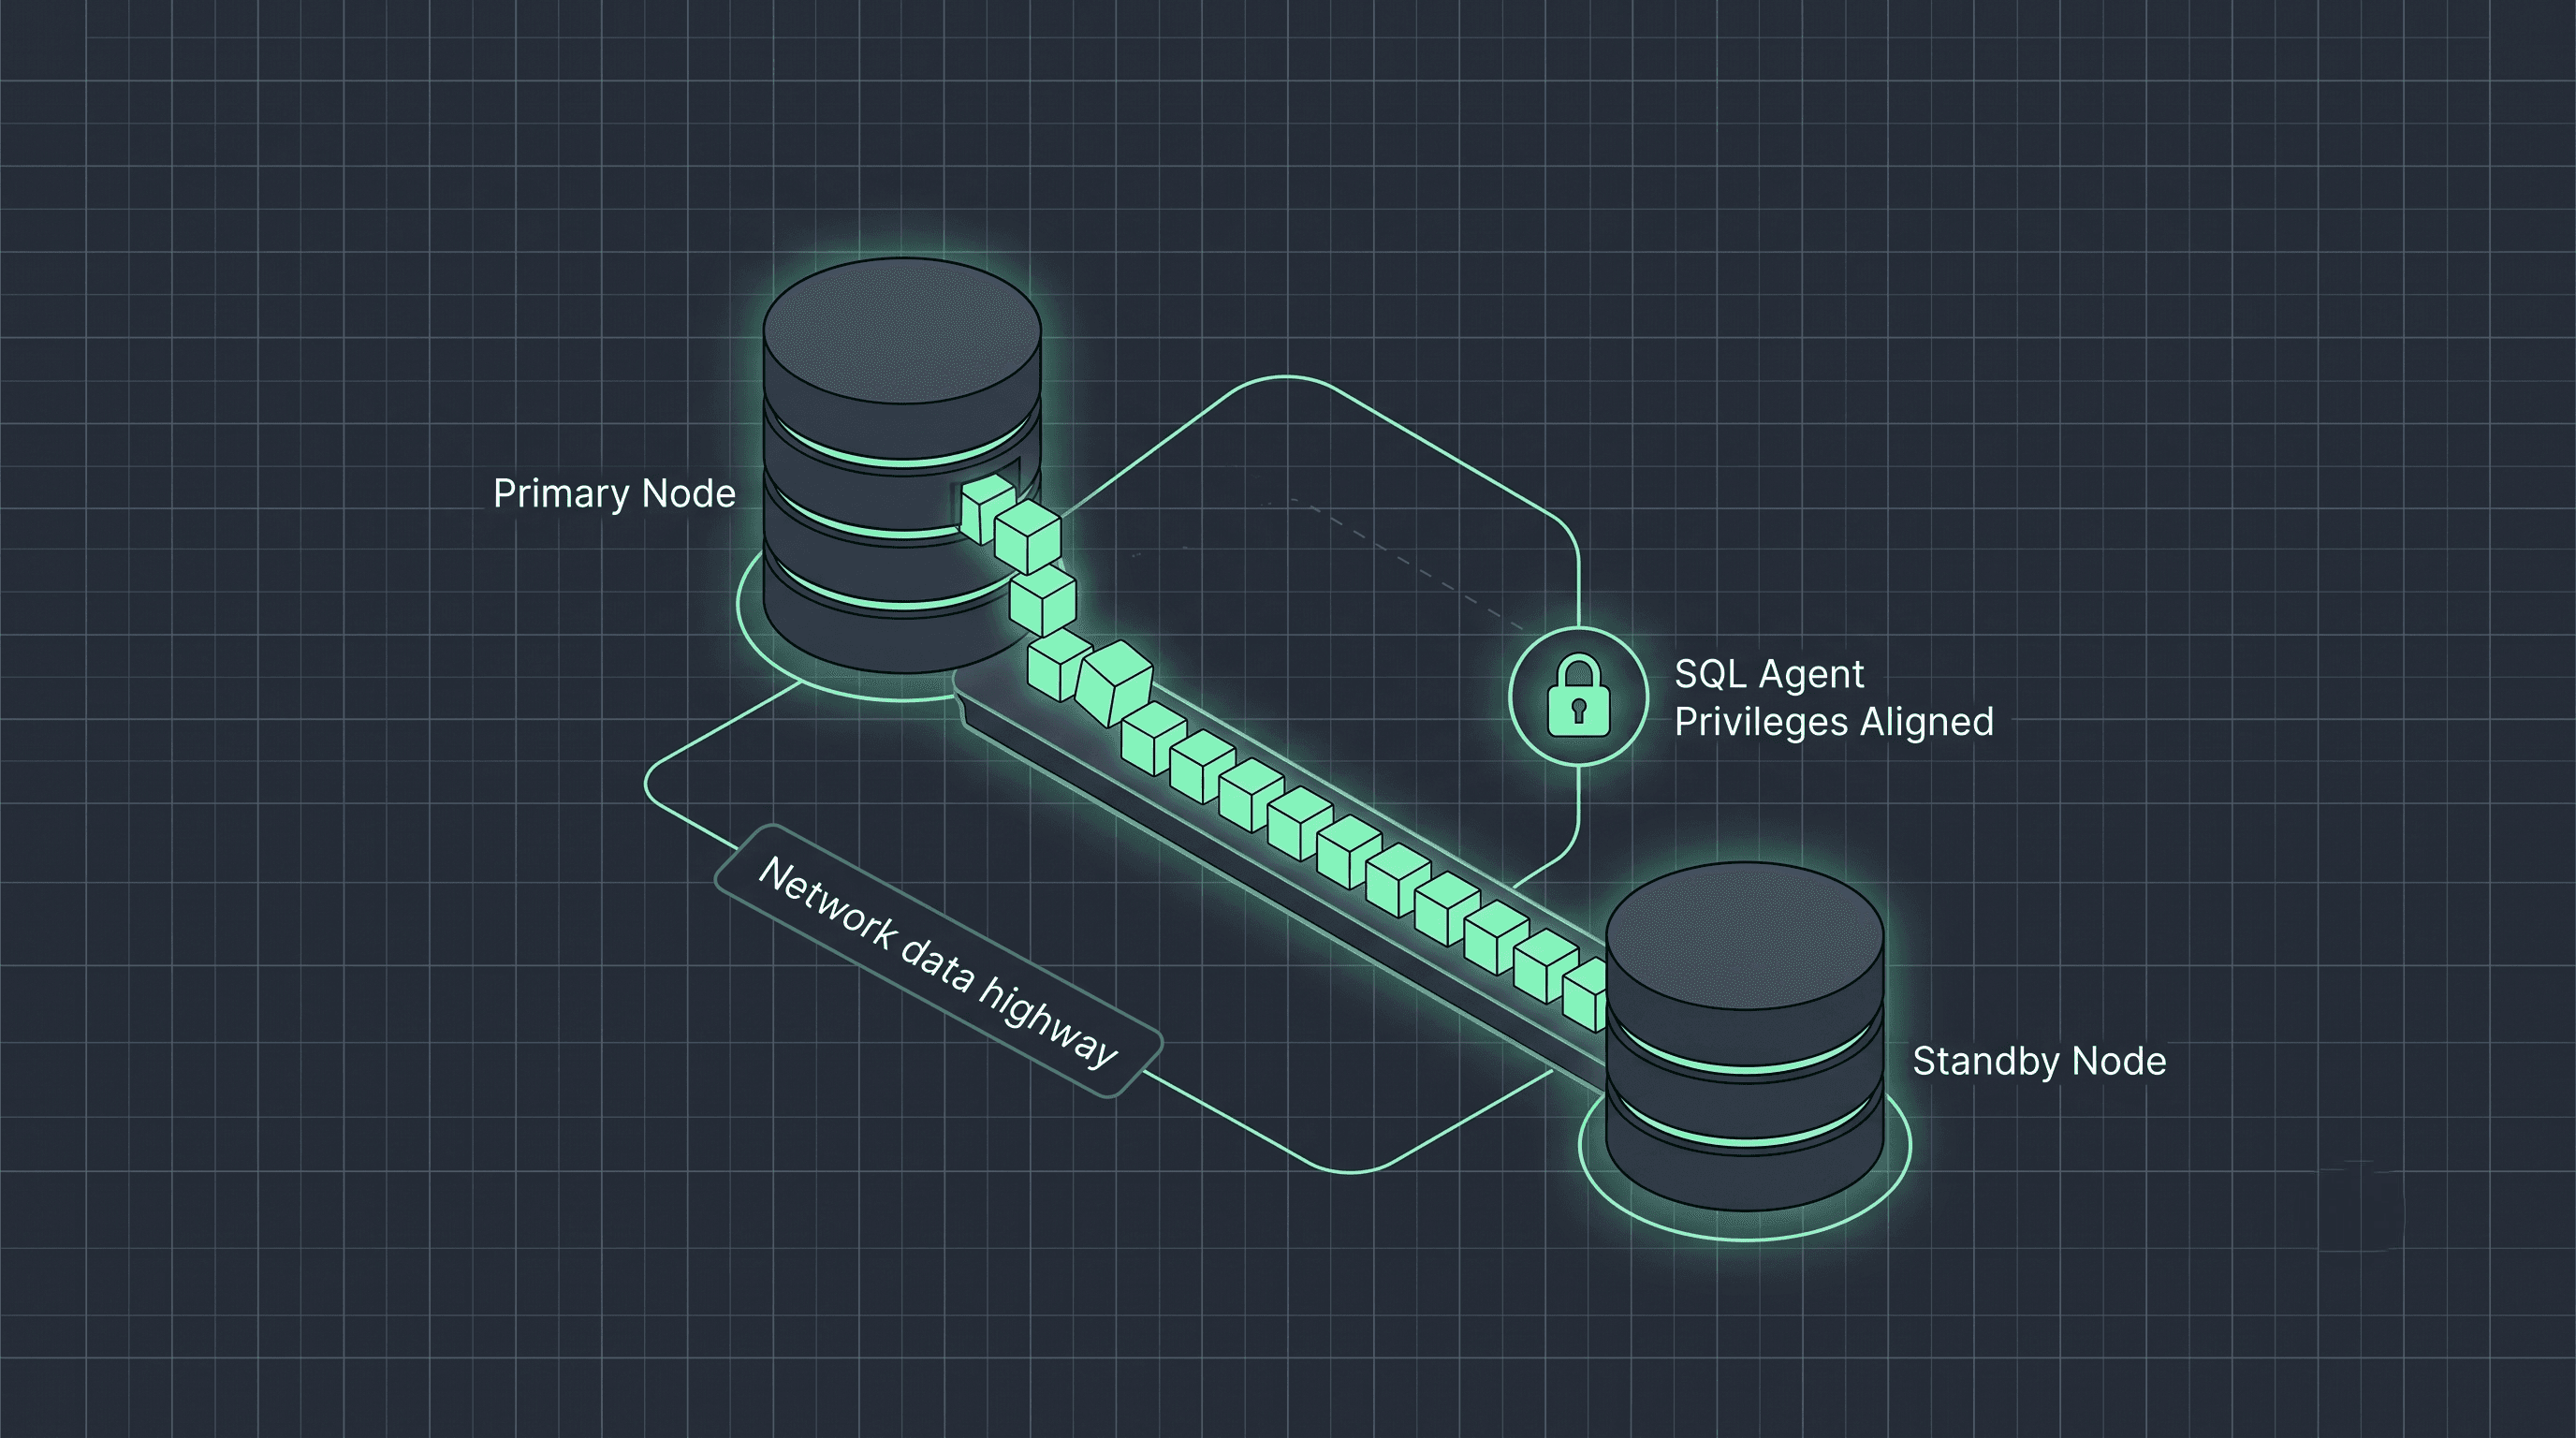
3. Diagram 1: Synchronous vs. Asynchronous Bottleneck Vectors
This architectural layout highlights how your chosen availability mode shifts performance overhead back onto your primary production worker threads.

When tracking down AlwaysOn performance friction, never rely on generic monitoring estimates. Query the live engine metadata states view sys.dm_hadr_database_replica_states to calculate the precise, byte-level data lag tracking metrics across your nodes:
SELECT
    ar.node_name AS [ReplicaServerName],
    db_name(drs.database_id) AS [DatabaseName],
    drs.is_local AS [IsLocalReplica],
    drs.synchronization_state_desc AS [SyncState],
    -- Calculate data latency sitting at the Primary DC awaiting network delivery
    CAST((drs.log_send_queue / 1024.0) AS DECIMAL(18,2)) AS [Log_Send_Queue_MB],
    -- Calculate data latency sitting at the DR Node awaiting execution processing
    CAST((drs.redo_queue / 1024.0) AS DECIMAL(18,2)) AS [Redo_Queue_MB],
    -- Measure active processing throughput velocity
    CAST((drs.redo_rate / 1024.0) AS DECIMAL(18,2)) AS [Redo_Rate_MB_Per_Sec],
    -- The ultimate disaster recovery metric: The exact time-lag gap
    drs.secondary_lag_seconds AS [True_Secondary_Lag_Seconds]
FROM sys.dm_hadr_database_replica_states drs
JOIN sys.availability_replicas ar ON drs.replica_id = ar.replica_id
ORDER BY [True_Secondary_Lag_Seconds] DESC;
GO
Decoding the Operational Telemetry
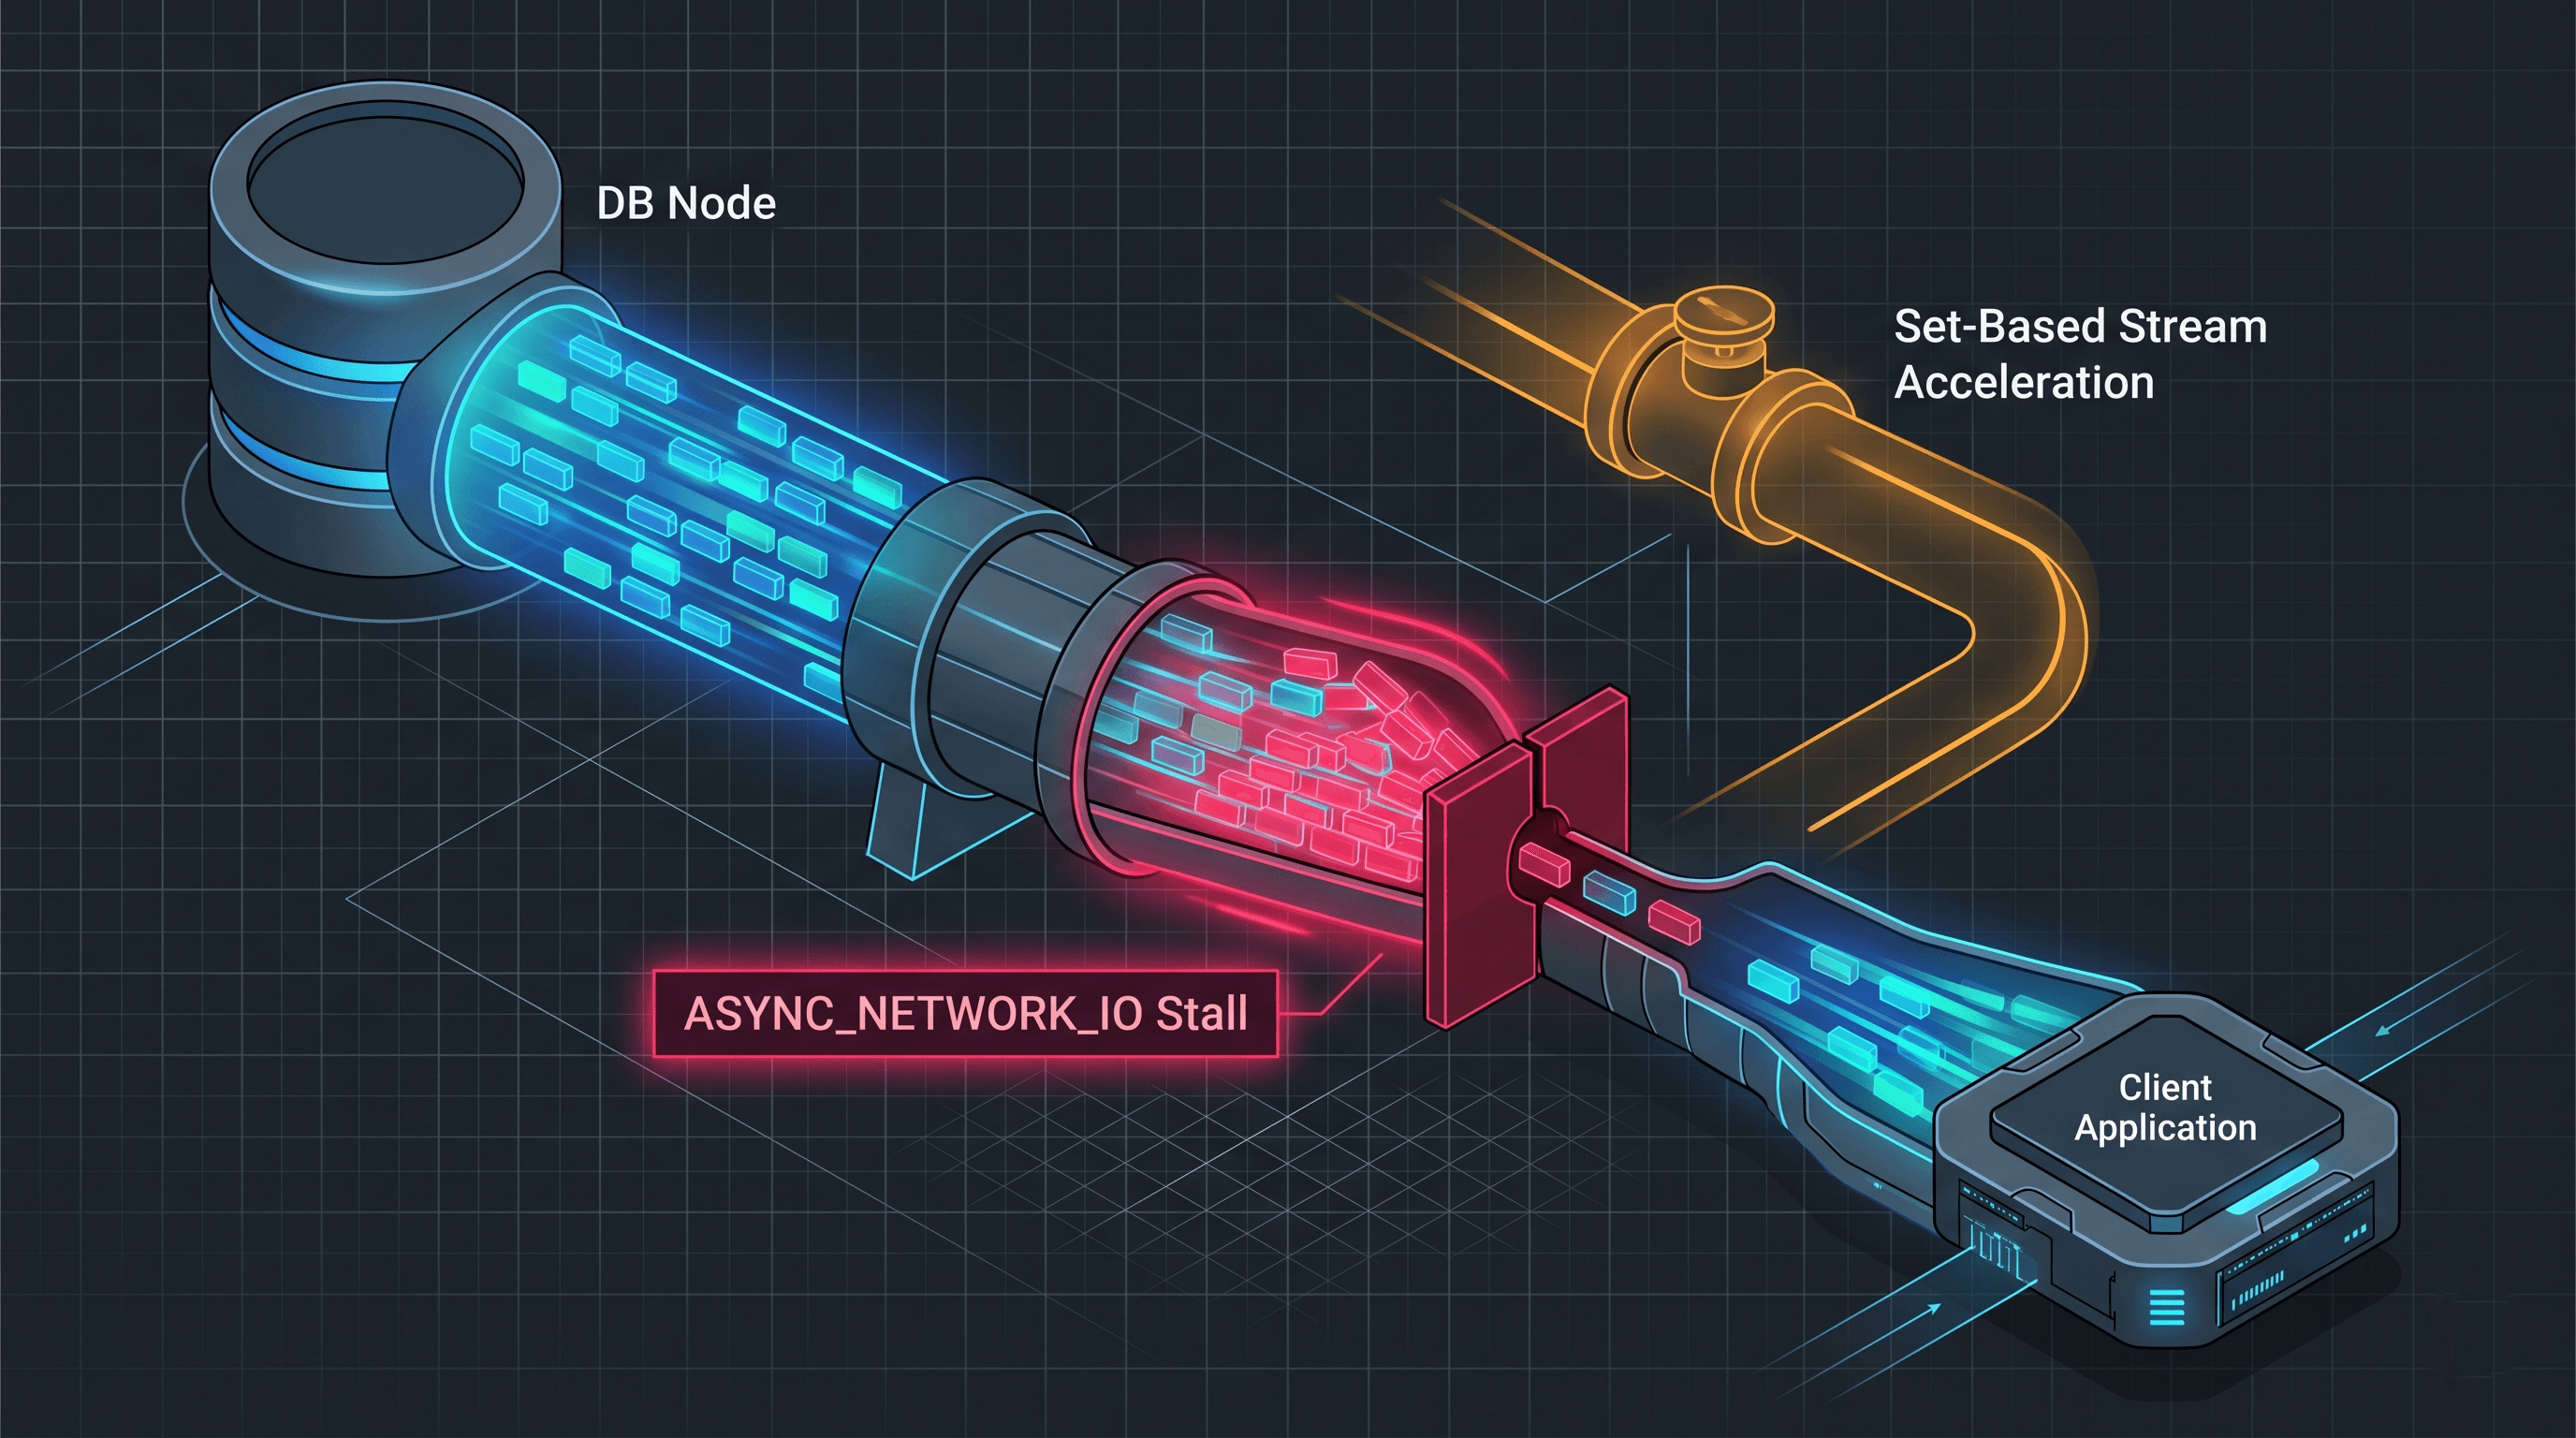
High Log Send Queue ($>$ 0) + Low Redo Queue: Your bottleneck is upstream. The primary node cannot push log data fast enough. This points directly to network pipeline saturation, packet drop rates over WAN links, or disk read throttling on your primary .ldf drive array.
Low Log Send Queue + High Redo Queue ($>$ 0): Data transport is perfect, but the secondary node cannot process the incoming workload. This confirms a REDO Thread Bottleneck.
5. Cracking the Secondary REDO Thread Bottleneck
A common production issue that catches senior architects off guard is the Serialized Redo Block.
While the primary SQL Server instance leverages thousands of parallel execution worker threads to handle multi-user application writes simultaneously, the secondary replica historically processes those incoming log records sequentially using a heavily bound, localized REDO thread structure.
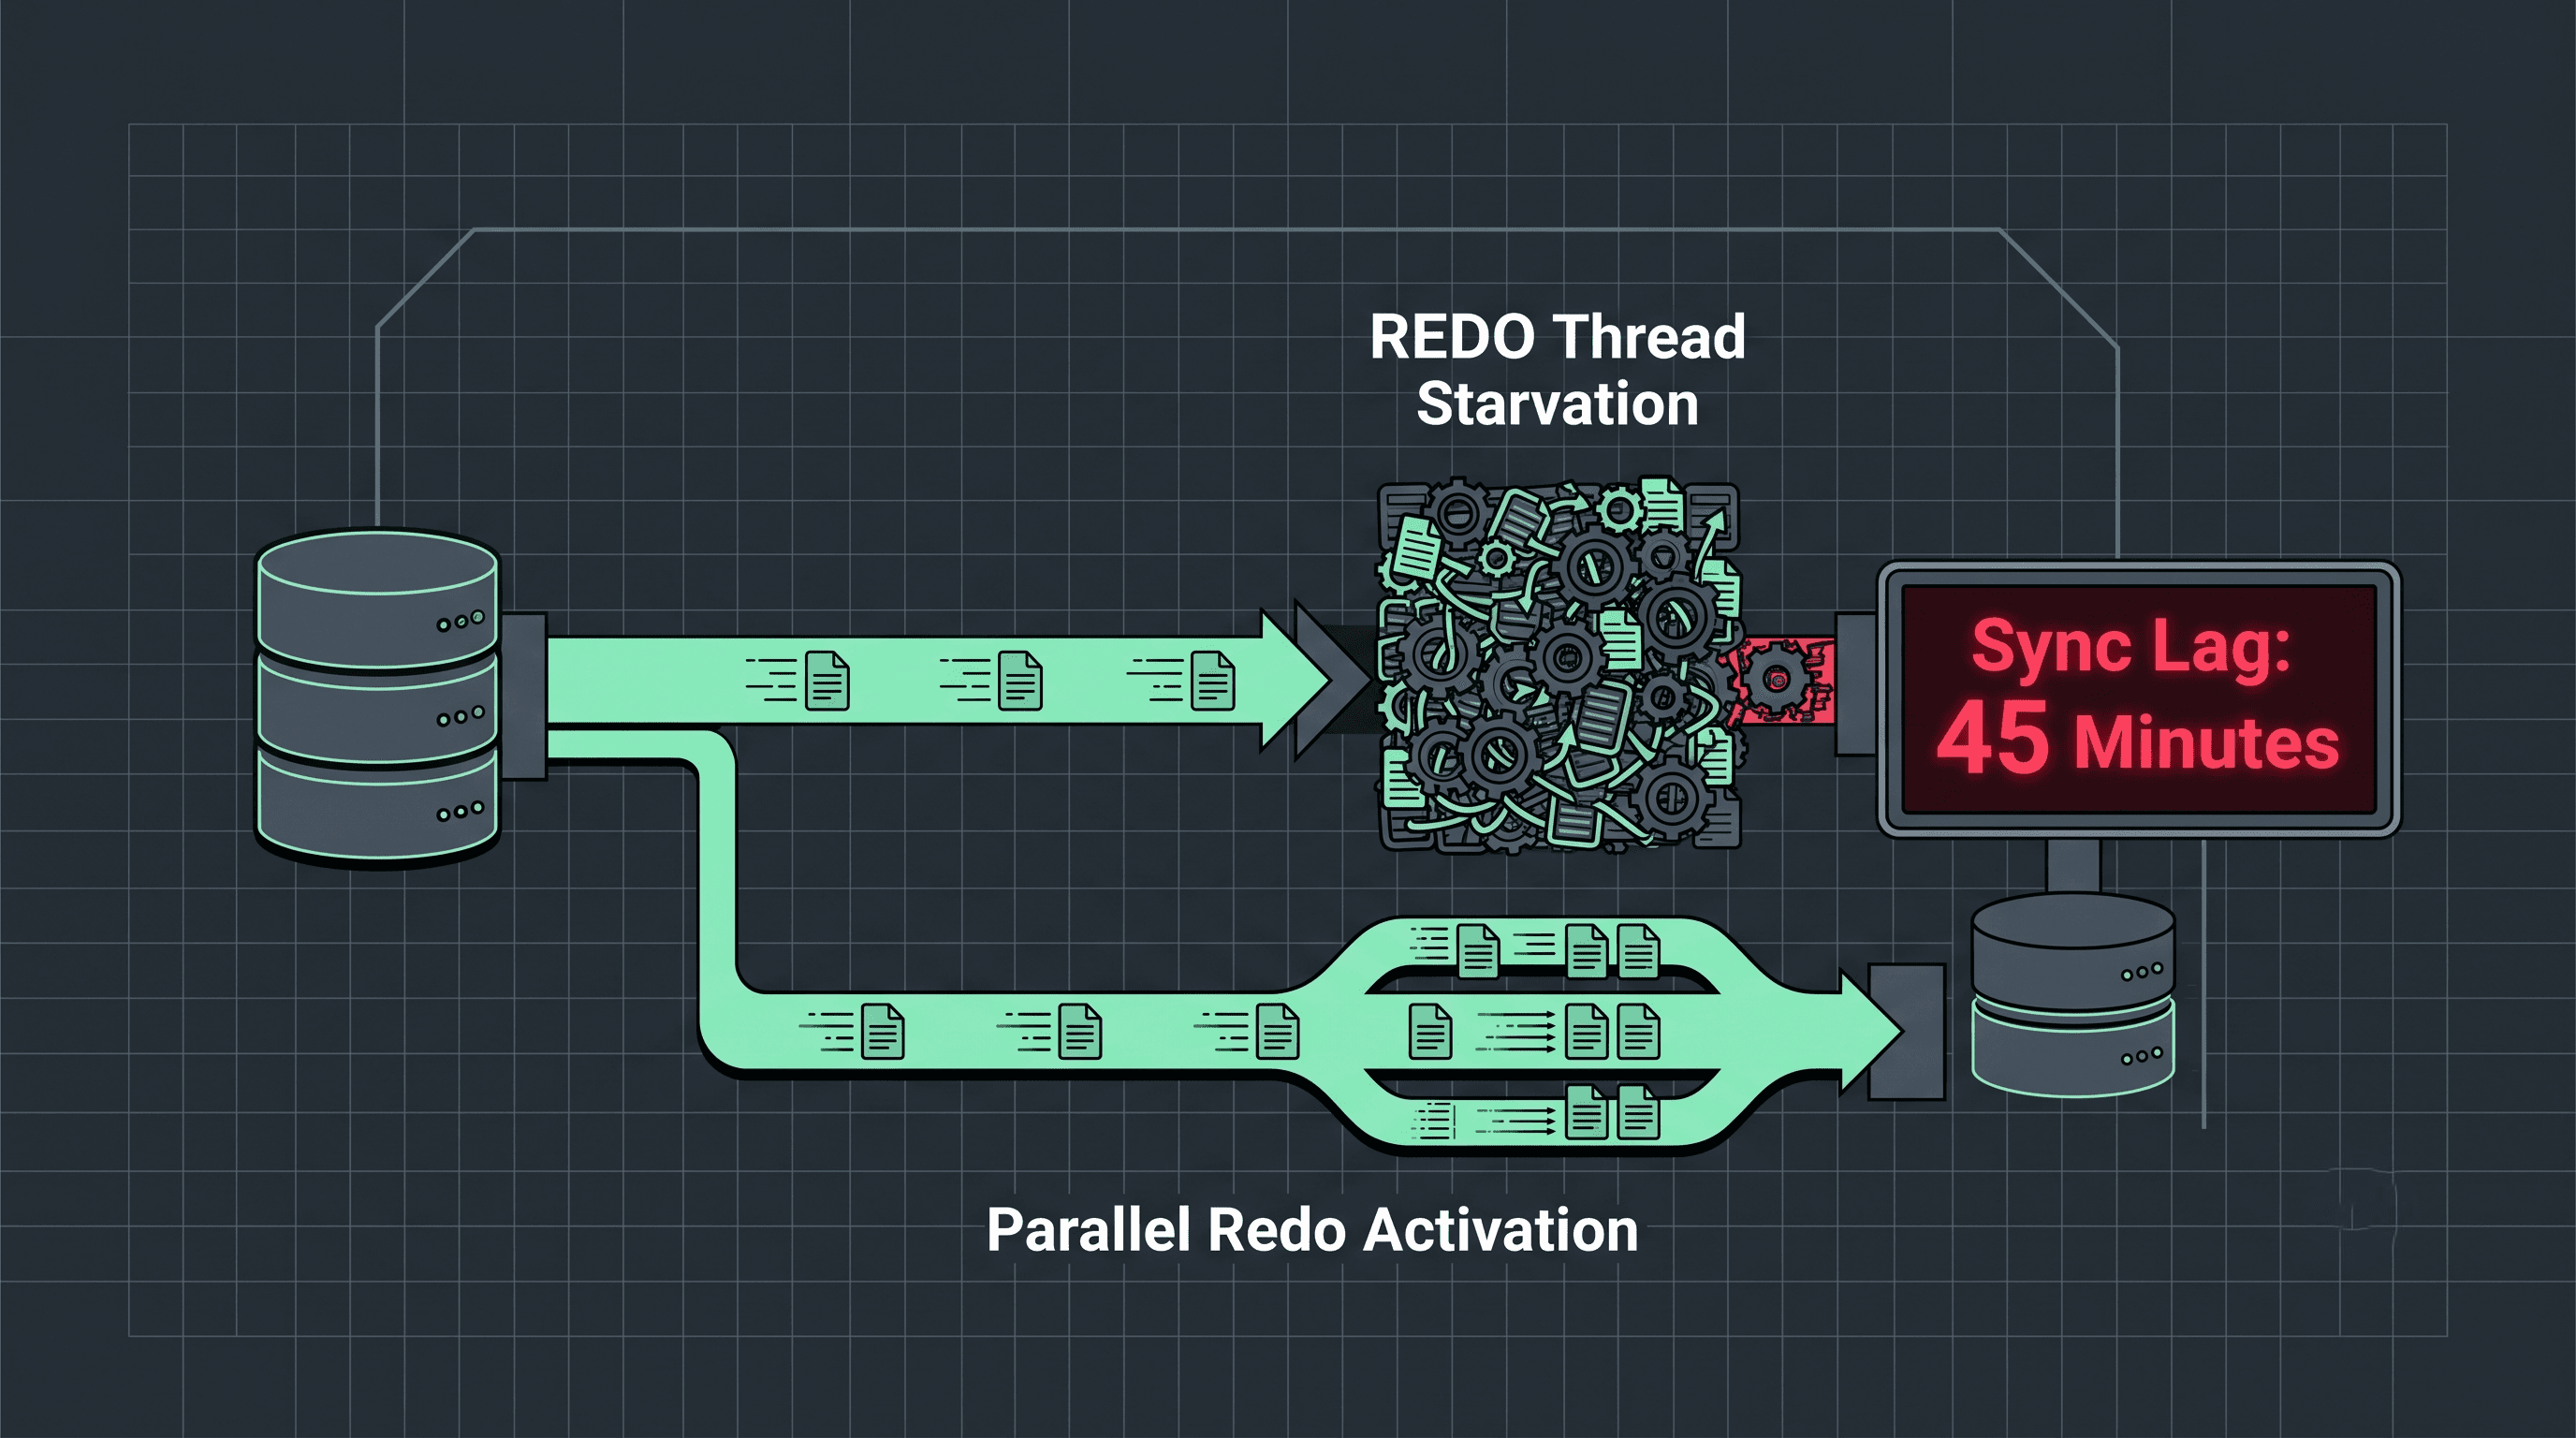
Diagram 2: The Parallel-to-Serialized Bottleneck Funnel
This architectural map tracks how a massive, highly parallel multi-threaded write workload becomes serialized on your recovery infrastructure, causing database latency spikes.

The Hidden Catalyst: Read Intent Lock Contention
If you configure your AlwaysOn secondary replica as a Readable Secondary to offload heavy reporting workloads and Excel extracts away from your primary node, those read queries can trigger severe sync lag.
When an intensive reporting query runs on the secondary replica, it acquires Shared (S) locks and stability locks on the database schemas to read data consistently. If the incoming log replication stream needs to update one of those exact tables (e.g., executing an ALTER TABLE schema update or modifying data pages), the secondary REDO thread requests an Exclusive (X) lock.
Because readers and writers cannot merge, the reporting query blocks the REDO thread. The replication engine grinds to a complete halt, and the redo queue expands exponentially until the user's reporting query finishes execution.
6. Enterprise Mitigation & Tuning Playbook
To eliminate Availability Group latency vectors and scale your replication performance, deploy a three-tiered infrastructure tuning configuration:
1. Enable Parallel Redo Architecture Explicitly
Modern versions of SQL Server (2016 through 2025+) default to a Parallel Redo framework, booting up multiple worker allocation helper threads to scale across high-capacity NUMA core nodes. However, if your environment processes highly transactional workloads with small, frequent rows, parallel redo can experience synchronization latch friction (DIRTY_PAGE_TABLE_LOCK). If your telemetry shows parallel redo stalling, you can drop a trace flag to force optimized serialized streaming or look at upgrading allocation thresholds:
-- Forcing advanced single-threaded sequential streaming to eliminate parallel redo latch locks
-- Senior Advice: Test this extensively in staging to track performance throughput changes
DBCC TRACEON (3449, -1);
GO
2. Isolate and Tune Endpoint Network Windows
By default, the SQL Server database mirroring endpoints negotiate network traffic using standard TCP window size properties. If your primary and secondary servers are separated by long physical distances (such as cross-region cloud deployments), configure your underlying host operating system networks to support TCP Window Scaling and adjust endpoint packet payloads to eliminate network transit boundaries.
3. Implement Strict Snapshot Isolation on Read Replicas
To permanently prevent heavy reporting tools from blocking your secondary node's REDO threads, force your read-intent workloads to leverage optimistic row versioning. This matches our RCSI strategy from Topic 19:
-- Execute directly on the primary context to allow non-blocking reads on secondary nodes
ALTER DATABASE [YourDatabaseName] SET ALLOW_SNAPSHOT_ISOLATION ON;
GO
When snapshot isolation is active on a readable secondary replica, incoming read queries fetch pre-committed historical records directly from the version store without acquiring blocking Shared locks. The secondary REDO thread can modify pages instantly without experiencing lock contention, keeping your data synchronized in near real-time.
By monitoring log send and redo queues via system DMVs, resolving lock friction on readable nodes with snapshot isolation, and optimizing network endpoint properties, you preserve your data recovery parameters and guarantee elite data protection speeds across enterprise infrastructures.
How are you managing data synchronization metrics across your geo-replicated AlwaysOn Availability Groups? Have you hit severe REDO thread contention loops while balancing read-intent reporting applications? Let's discuss high-availability architecture and cluster tuning in the comments below!