Low Page Life Expectancy: How to Fix SQL Server Buffer Pool Memory Pressure
Keeping data alive in memory: Why Page Life Expectancy drops, how to detect hidden memory-churning queries, and how to stabilize your data cache.
It is a silent performance decline that catches infrastructure teams completely off guard. Your application behaviour starts showing subtle delays, page load times creep upward, and your storage metrics show a sudden, uncharacteristic spike in read operations. When you open your server performance monitor to check on memory health, you notice a critical metric tanking: Page Life Expectancy (PLE) has dropped from a healthy score of several thousand down into the double digits.
When Page Life Expectancy drops, your database performance drops with it. Your server is burning up processing power constantly reading the exact same data blocks off your storage drives over and over again.
When facing low PLE, many administrators automatically assume the only fix is to throw money at the problem by provisioning more physical RAM modules. Let's look at what Page Life Expectancy actually means in plain language, why your data cache is throwing out healthy pages, and how to find and tune the resource-heavy queries causing memory pressure.
1. The Real-World Analogy: The Overcrowded Library Reading Desk
To understand how the buffer pool and Page Life Expectancy operate, look at how a researcher works inside a major metropolitan reference library.
The Database Storage (The Library Basement Stacks): This is where millions of historical books are kept permanently. Pulling a book from the basement takes a long time because you have to wait for an assistant to go down and get it (The Storage Drive Read).
The Buffer Pool Data Cache (The Researcher's Reading Desk): To work fast, the researcher brings ten books up from the basement and spreads them out across a wide wooden desk (The RAM Buffer Pool). Now, if they need to double-check a fact, they just look down at the desk. This takes a fraction of a second.
Page Life Expectancy (Time on the Desk): If the desk is peaceful, a book might sit open on the counter for five hours (High PLE) before being put away.
Memory Pressure (The Aggressive Delivery Worker): Suddenly, a helper enters the room carrying a giant stack of 50 massive dictionary volumes that a different reader requested (
SELECT * FROM HugeTable). Because the reading desk is completely full, the helper has no choice but to grab the researcher's open reference books and toss them down the laundry chute back to the basement to clear space.The Churn: Two seconds later, the researcher needs that reference book again. They must sit and wait while the assistant runs back down to the basement to retrieve it, only for the helper to throw it back down the chute five minutes later. The researcher spends all day waiting, and the system grinds to a halt.
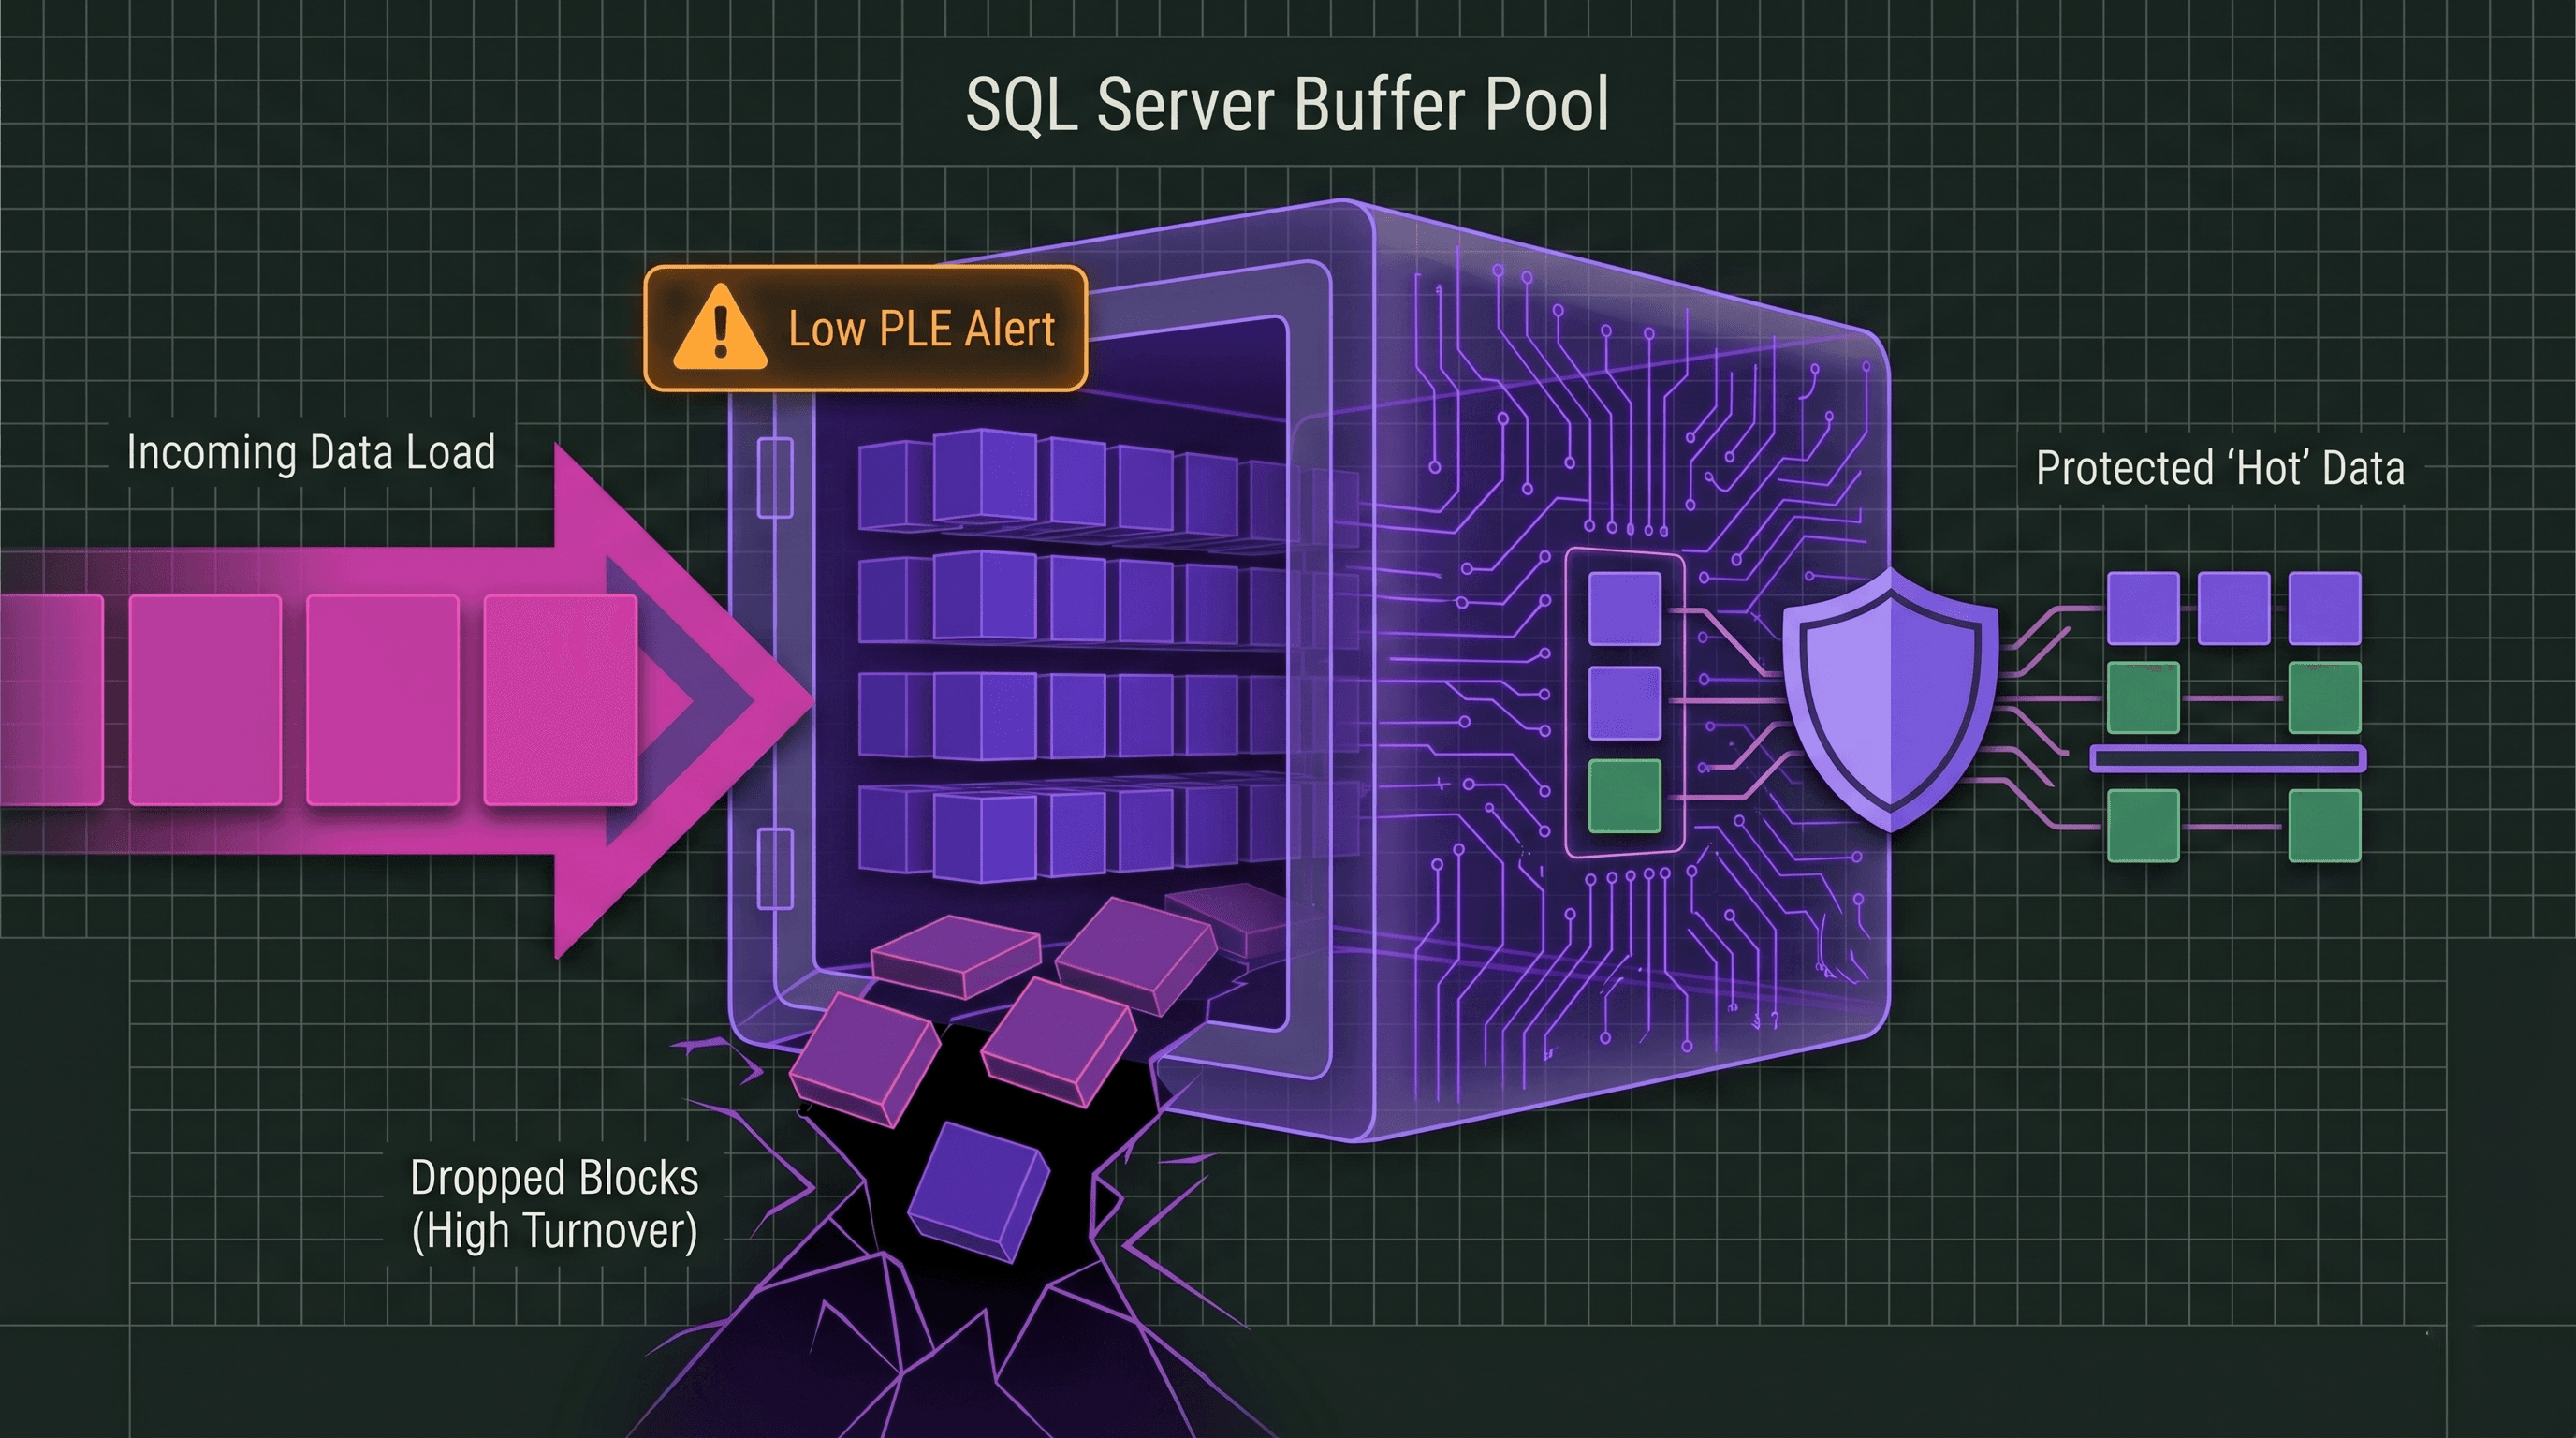
In SQL Server, a low Page Life Expectancy means a heavy query is flooding your RAM cache, forcing the engine to clear out useful data pages and read them repeatedly from slow disks.
2. The Mechanics: Understanding the "300 Seconds" Myth
Every page read from a storage drive is loaded into a dedicated memory workspace known as the Buffer Pool. SQL Server wants to keep those pages sitting in RAM permanently so that subsequent user requests don't have to experience disk latency.
If you search the internet for database performance baselines, you will see an old rule of thumb stating that your Page Life Expectancy should always be above 300 seconds.
This value is an outdated metric calculated back in the late 1990s when a standard production server had only 4 Gigabytes of total RAM. Today, modern database instances regularly manage 64GB, 256GB, or even Terabytes of memory.
If you have a 256GB buffer pool, a PLE score of 300 seconds means your server is churning through massive amounts of data per second. A modern, healthy server handling normal operational volumes should maintain a PLE baseline measured in thousands of seconds. A sudden drop down to low numbers indicates a critical query is actively flushing your memory pipeline.
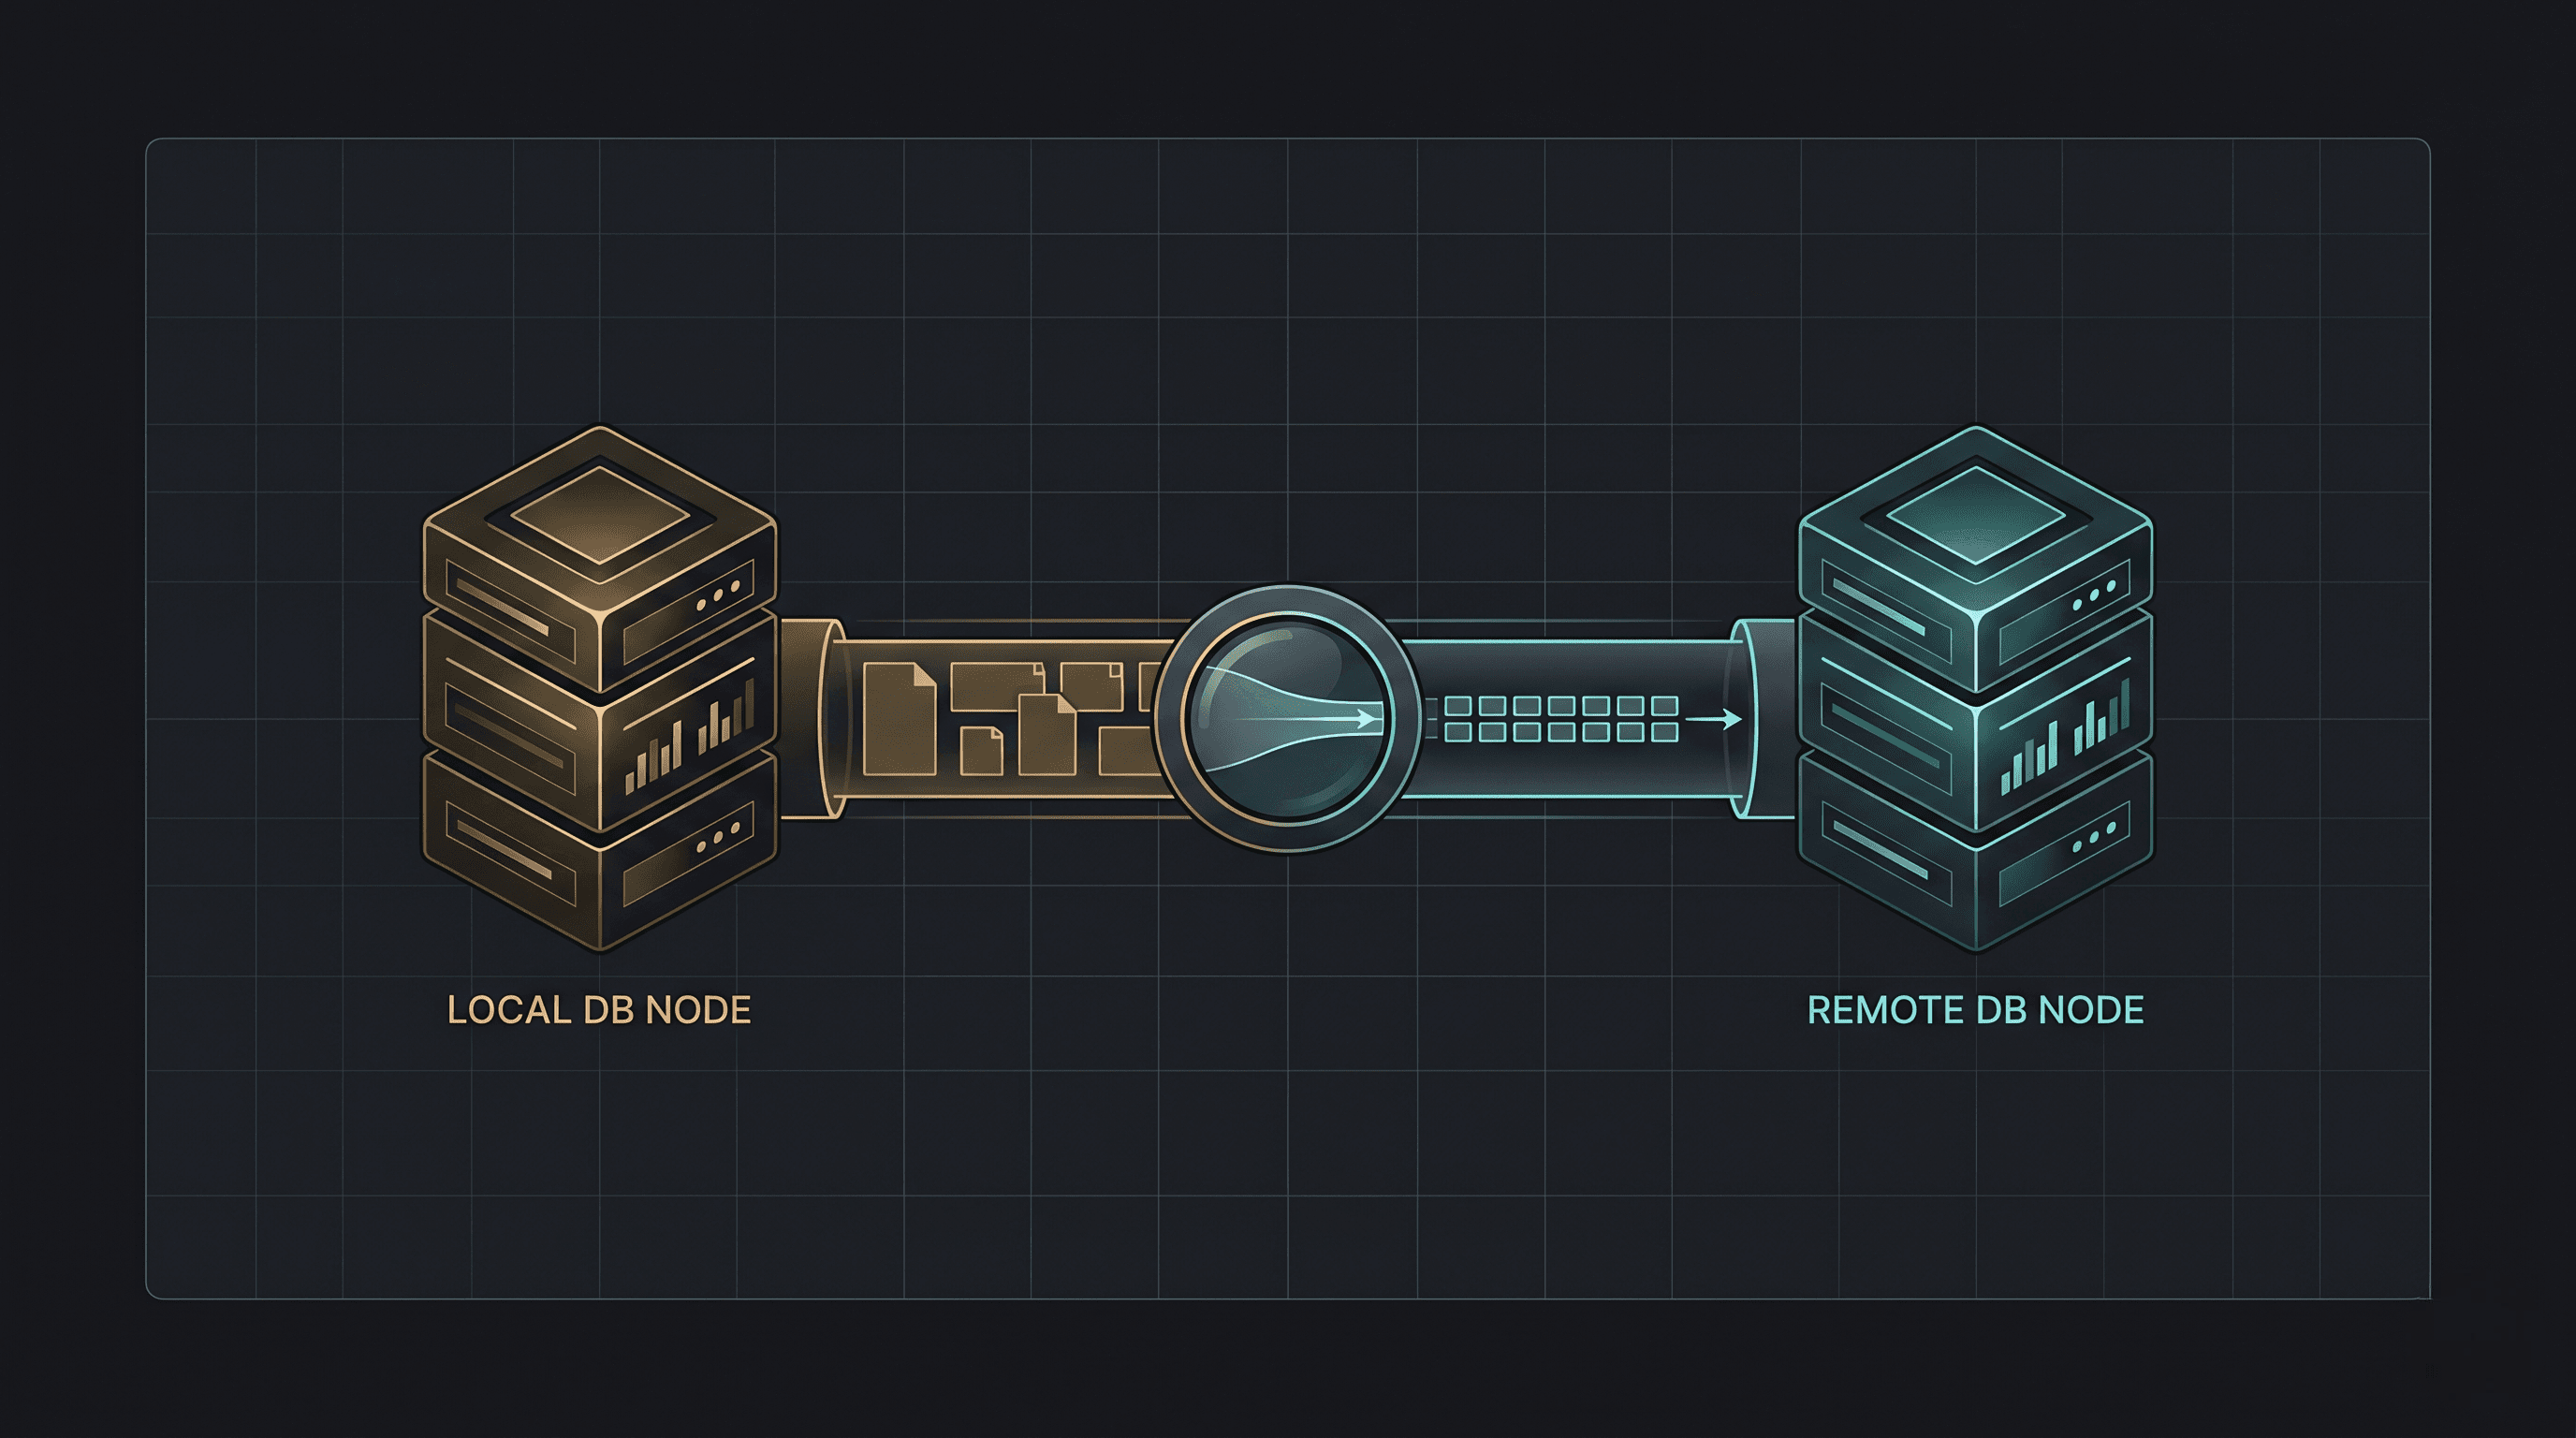
3. Diagram 1: Healthy Cache Retention vs. High Memory Churn
This engineering layout visualizes how a massive data sweep disrupts a stable memory cache, dropping page retention times and forcing expensive disk lookups.

4. Live Triage: Exposing Your Real-Time PLE and Memory Hogs
When your server starts experiencing heavy disk I/O, you need to quickly pull your true Page Life Expectancy metrics across all active memory nodes and isolate the queries causing the churn.
Run this plain-language diagnostic script to check your real-time PLE baseline:
SELECT
    object_name AS [Performance_Category],
    counter_name AS [Metric_Name],
    cntr_value AS [Page_Life_Expectancy_Seconds],
    -- Provide a natural translation of the server state
    CASE
        WHEN cntr_value < 300 THEN 'CRITICAL: Severe Memory Pressure!'
        WHEN cntr_value BETWEEN 300 AND 1000 THEN 'WARNING: Active Cache Churn'
        ELSE 'Healthy Cache Longevity'
    END AS [Cache_Health_Status]
FROM sys.dm_os_performance_counters
WHERE object_name LIKE '%Buffer Manager%'
  AND counter_name = 'Page life expectancy';
GO
If this script reveals a low score, you must immediately hunt down the queries that are reading the most physical pages from disk into memory. Run this tracking script to locate your top memory consumers:
SELECT TOP 5
    st.text AS [QueryText],
    qs.execution_count AS [Execution_Count],
    -- View the total number of 8KB data pages read from disk
    qs.total_physical_reads AS [Total_Physical_Disk_Reads],
    -- View the total number of pages read directly from memory
    qs.total_logical_reads AS [Total_Logical_RAM_Reads],
    qp.query_plan AS [ExecutionPlanMap]
FROM sys.dm_exec_query_stats qs
CROSS APPLY sys.dm_exec_sql_text(qs.sql_handle) st
CROSS APPLY sys.dm_exec_query_plan(qs.plan_handle) qp
ORDER BY qs.total_physical_reads DESC;
GO
5. How to Eliminate Memory Pressure and Raise Your PLE
Fixing a low Page Life Expectancy rarely requires purchasing new hardware. Instead, you need to minimize the volume of unnecessary data pages your queries pull into memory.
Step 1: Replace Table Scans with Covering Indexes
When a query executes a full table scan because it lacks an index, it forces SQL Server to read every single page of that table into the buffer pool, pushing out all other cached data. Build a targeted covering index to give the query a precise shortcut:
-- Building a tailored index allows the engine to fetch specific rows
-- without loading the entire physical table structure into RAM
CREATE NONCLUSTERED INDEX IX_Orders_CustomerID_Status
ON dbo.Orders (CustomerID, StatusID)
INCLUDE (OrderDate, TotalAmount);
GO
Step 2: Locate Your Largest Tables Devouring RAM Space
To find out where covering indexes will give you the biggest memory relief, you need to know which tables occupy the most physical space on your drive. Run this plain-language diagnostic script to list your top 5 largest tables sorted by total size:
SELECT TOP 5
    t.name AS [Table_Name],
    s.name AS [Schema_Name],
    p.rows AS [Total_Row_Count],
    -- Calculate total table footprint including data and index pages in Megabytes
    CAST((SUM(a.total_pages) * 8.0) / 1024.0 AS DECIMAL(18,2)) AS [Total_Space_MB],
    -- Calculate space used strictly by data rows
    CAST((SUM(a.data_pages) * 8.0) / 1024.0 AS DECIMAL(18,2)) AS [Data_Space_MB]
FROM sys.tables t
JOIN sys.indexes i ON t.object_id = i.object_id
JOIN sys.partitions p ON i.object_id = p.object_id AND i.index_id = p.index_id
JOIN sys.allocation_units a ON p.partition_id = a.container_id
JOIN sys.schemas s ON t.schema_id = s.schema_id
GROUP BY t.name, s.name, p.rows
ORDER BY SUM(a.total_pages) DESC;
GO
Step 3: Hunt Down Severe Index Fragmentation
Even a great index will waste space in your buffer pool if it is heavily fragmented. When pages split, they leave behind pockets of empty space, forcing SQL Server to load twice as many physical pages into RAM to read the exact same rows. Run this script to catch indexes with fragmentation scores above 30%:
SELECT TOP 5
    db_name(ips.database_id) AS [DatabaseName],
    object_name(ips.object_id) AS [TableName],
    i.name AS [Index_Name],
    -- A higher percentage means data pages are scrambled and poorly packed
    CAST(ips.avg_fragmentation_in_percent AS DECIMAL(5,2)) AS [Fragmentation_Percentage],
    ips.page_count AS [Total_Physical_Pages_Allocated]
FROM sys.dm_db_index_physical_stats(DB_ID(), NULL, NULL, NULL, 'LIMITED') ips
JOIN sys.indexes i ON ips.object_id = i.object_id AND ips.index_id = i.index_id
WHERE ips.avg_fragmentation_in_percent > 30.0 AND ips.page_count > 100
ORDER BY ips.avg_fragmentation_in_percent DESC;
GO
Step 4: Compact Fragmented Index Pages to Optimize RAM Space
Once you locate your bloated, fragmented indexes, run an immediate online rebuild pass. This packs the data rows tightly together into a uniform sequence, instantly reducing the physical footprint your tables take up inside your memory cache:
-- Rebuilding cleans up page splits and compresses data pages, boosting your PLE score
ALTER INDEX IX_Orders_CustomerID_Status ON dbo.Orders REBUILD WITH (ONLINE = ON);
GO
6. The Ultimate SQL Server Buffer Pool & Memory Management Cheat Sheet
For quick reference during a memory pressure crisis or disk performance decline, utilize this comprehensive multi-panel architecture dashboard to analyse page counts, track cache hit ratios, and stabilize your data storage pipelines.

Is your database server currently struggling with persistent disk read loops or sudden drops in Page Life Expectancy metrics? Did optimizing your heaviest table scans restore your memory retention times instantly? Let's talk buffer pool management and query tuning tips in the comments below!