Diagnosing SQL Server Always On Failovers: Error 1135 and VM Stuns
Root-causing cluster eviction events: How to isolate Windows Server Failover Cluster (WSFC) Error 1135, diagnose hypervisor snapshot stuns, and tune heartbeat thresholds for virtualized availability groups.
If you manage an enterprise-grade SQL Server Always On Availability Group (AG), few things are as frustrating as a sudden, unexpected failover in the middle of peak production hours. When you dig into the logs, you find a cryptic message: Error 1135.
Many database administrators waste hours digging through SQL Server error logs trying to figure out why the database engine crashed. But to solve this, you have to look outside the database. Error 1135 is a Windows Server Failover Cluster (WSFC) error, not a SQL Server error.
Here is a deep dive into the mechanics of Error 1135, why massive CPU spikes and VM "stuns" trigger it, and the exact scripts and architectural adjustments you need to stabilize your cluster.
Demystifying Error 1135: The Lost Heartbeat
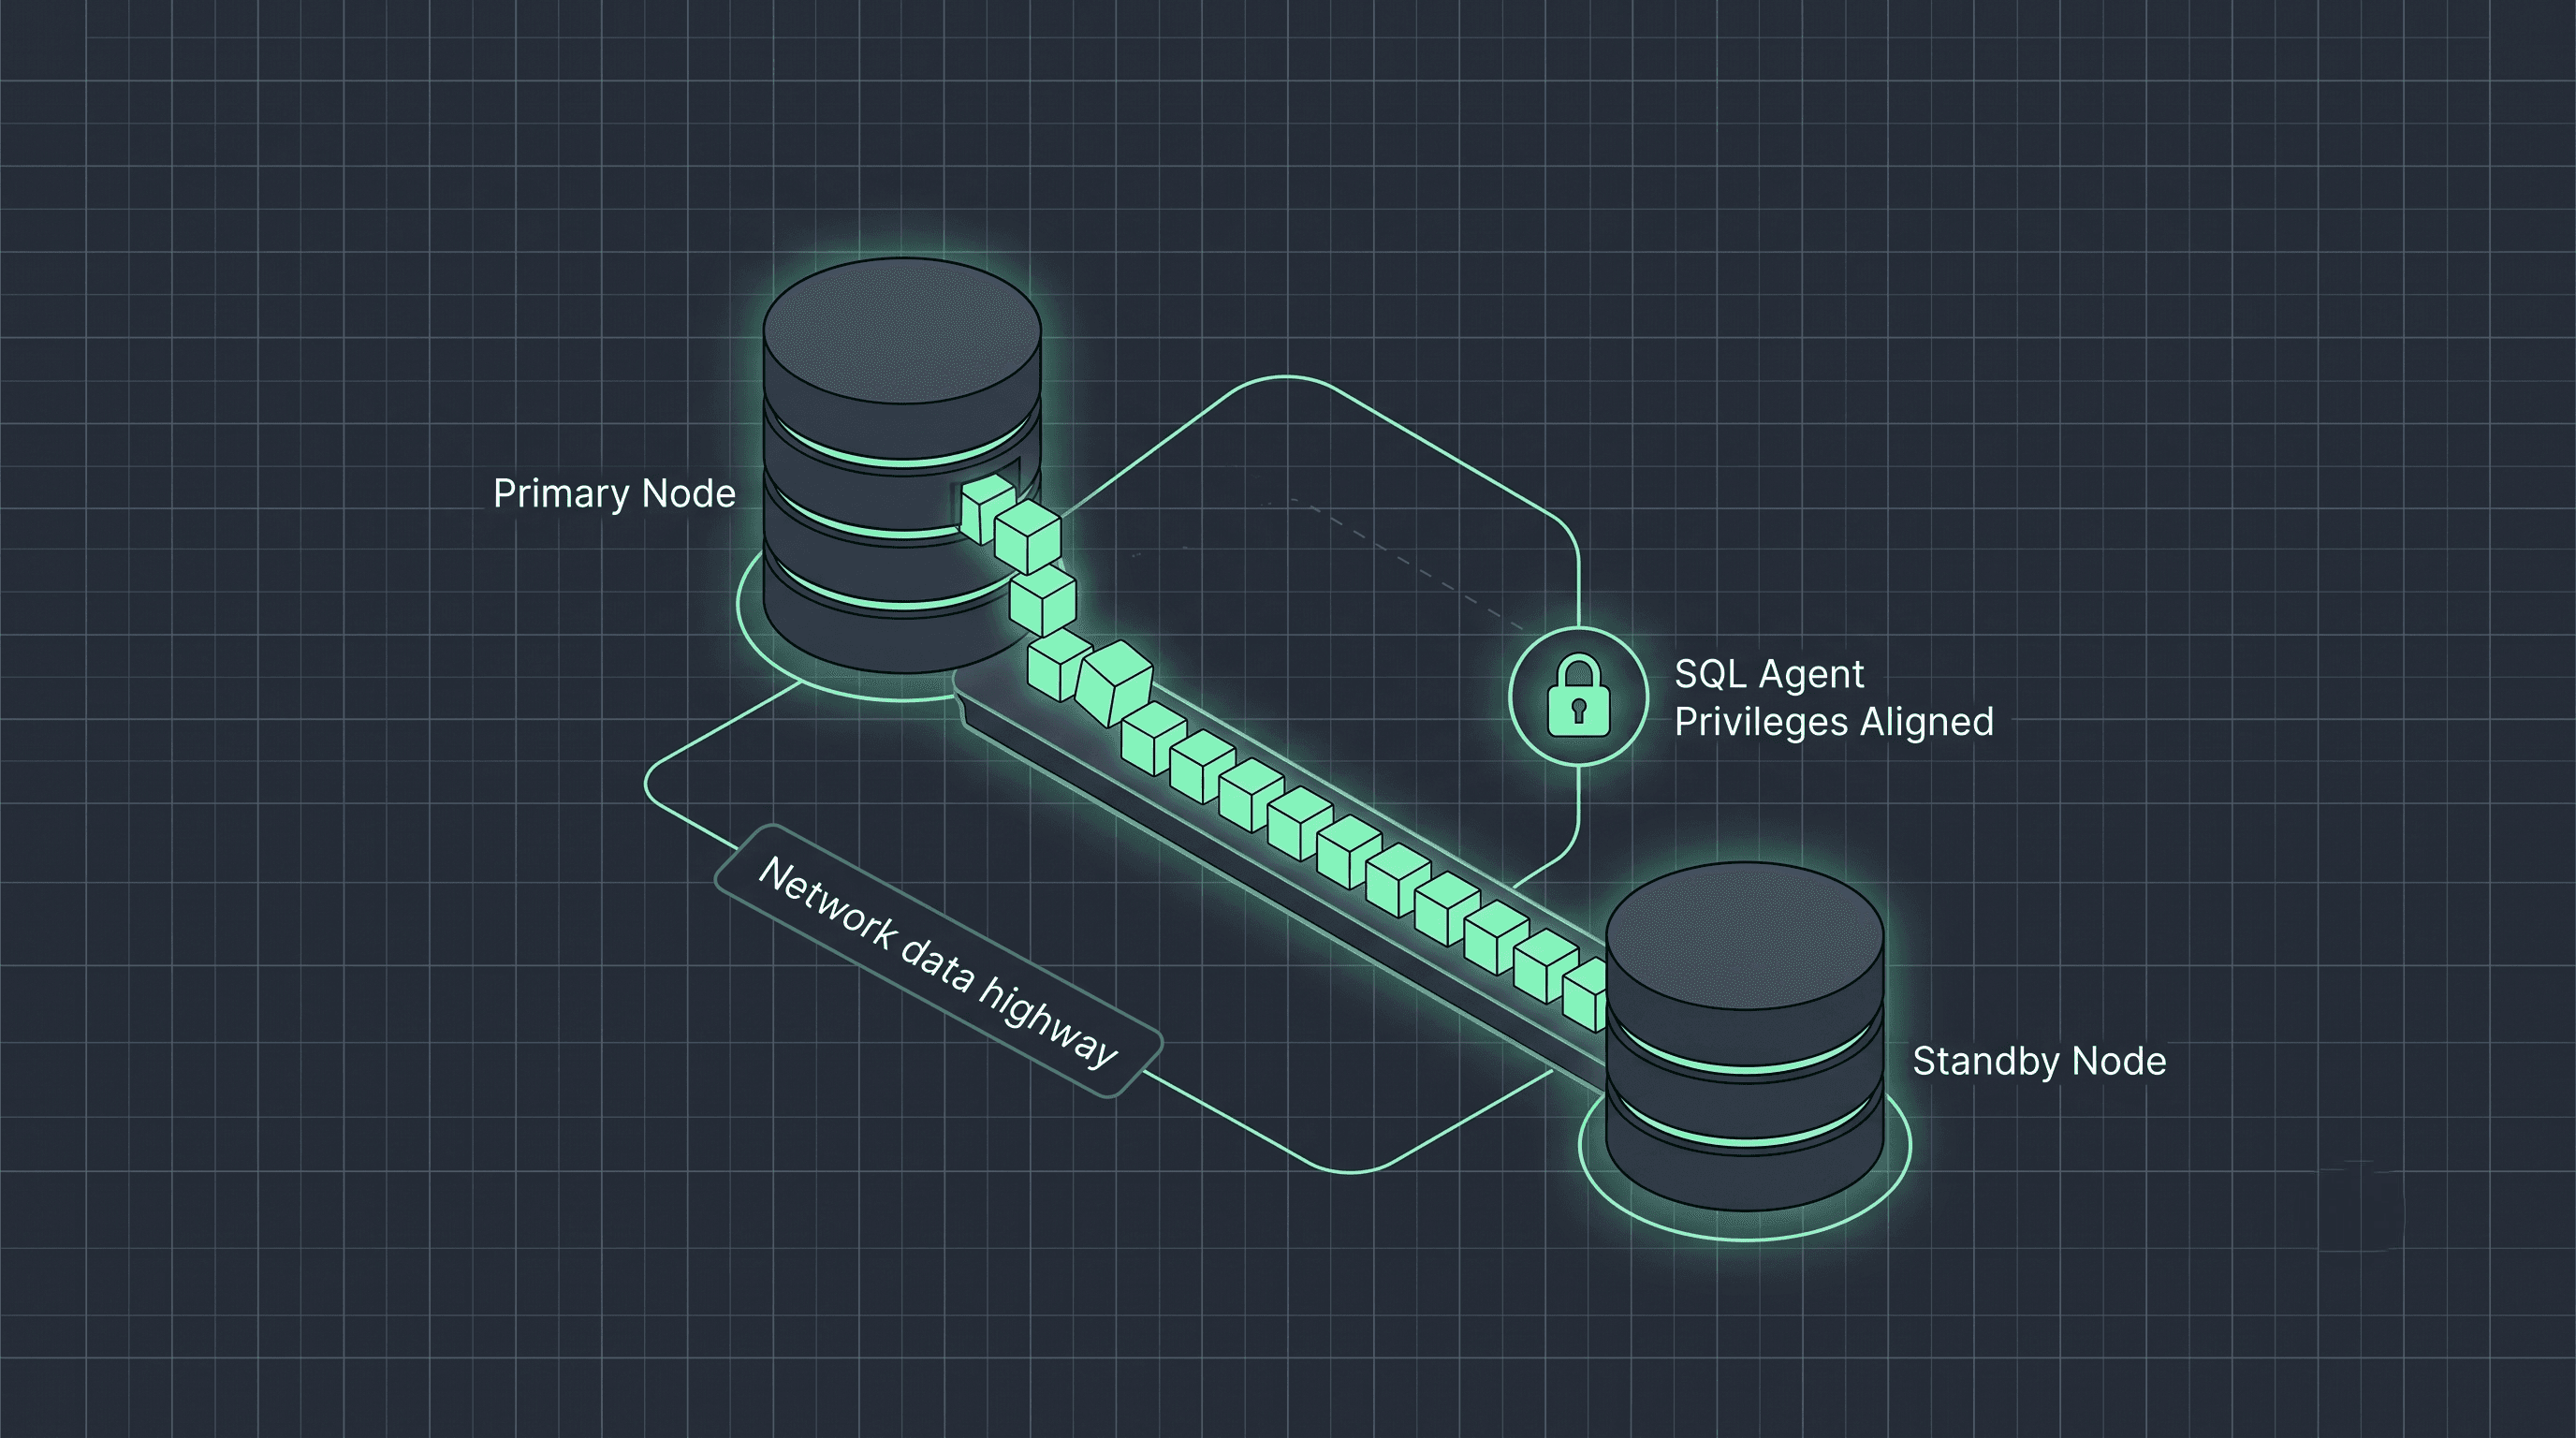
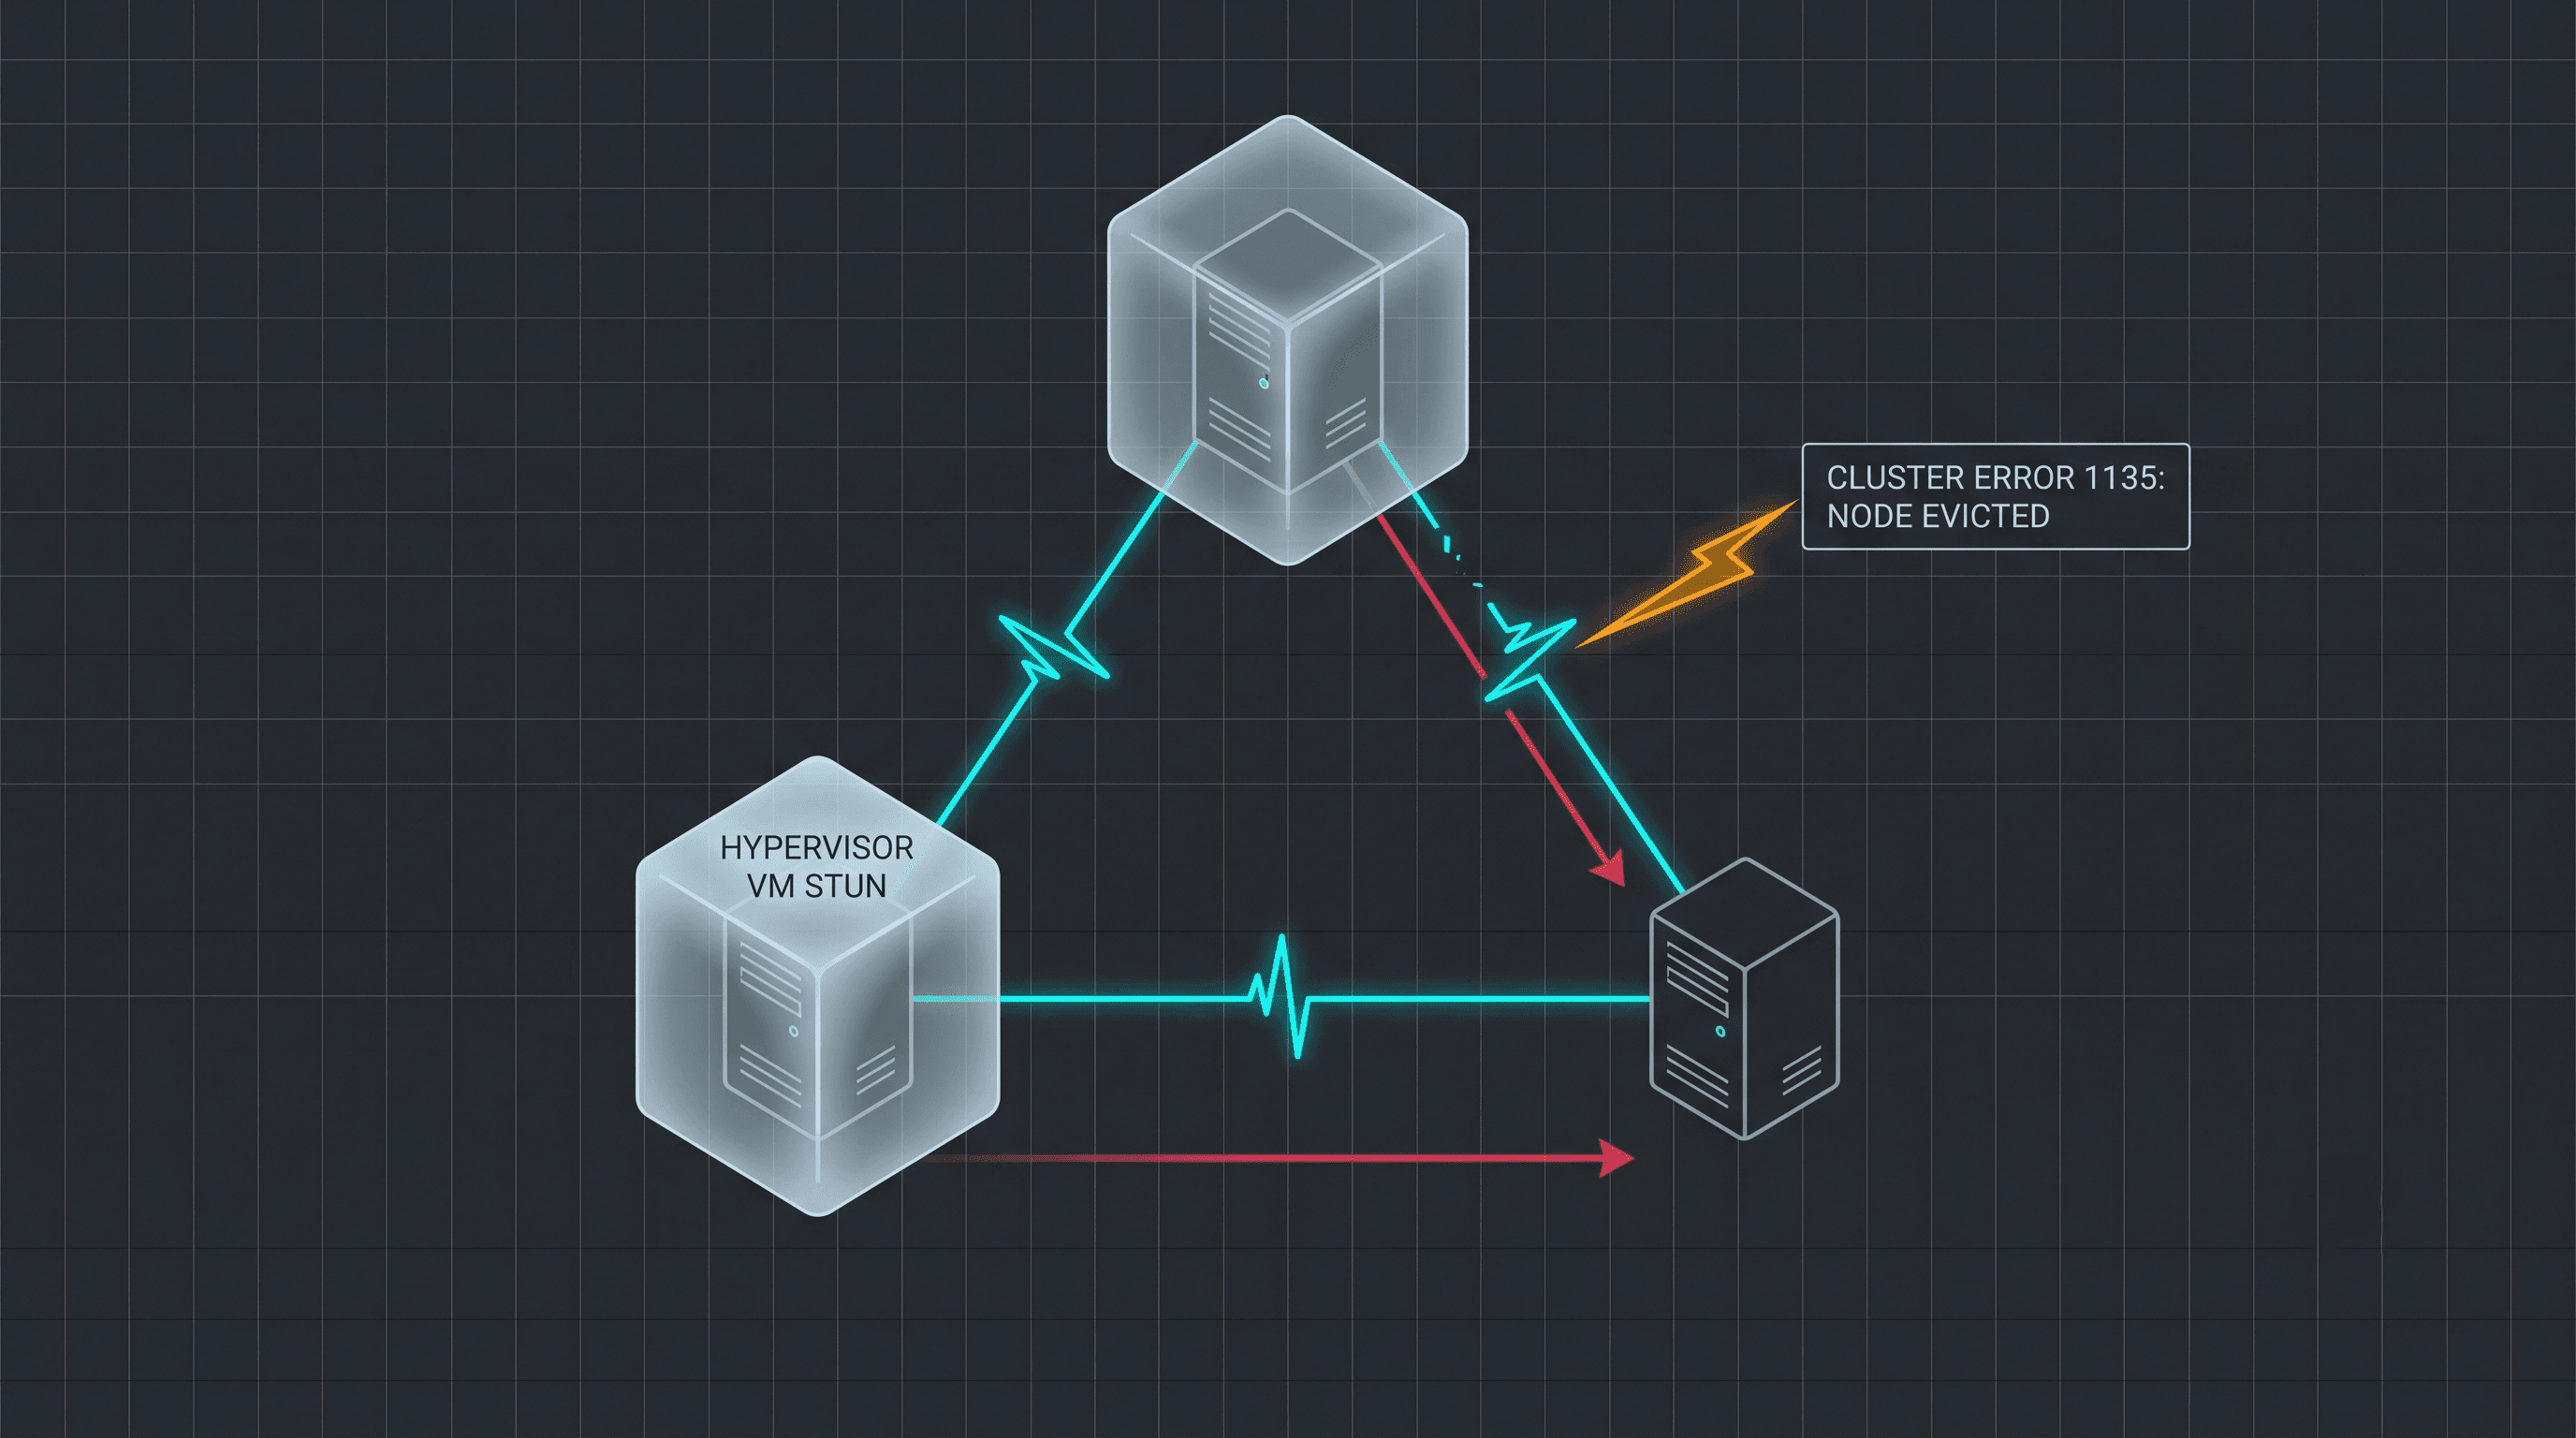
In a Windows Server Failover Cluster, the nodes constantly ping each other over the network to verify that everyone is still alive. This ping is called the cluster heartbeat.
By default, Windows is incredibly aggressive. It expects a heartbeat every 1 second. If a node misses 5 consecutive heartbeats (a mere 5-second window), the cluster assumes the node is dead. The WSFC forcefully evicts the unresponsive node from the cluster membership (logging Error 1135). Because the node has dropped out of the underlying Windows cluster, SQL Server has no choice but to initiate an immediate AG failover to protect the workload.
The database didn't fail. The operating system lost its ability to communicate.
The Deadly Combination: 100% CPU and the 211-Second Stun
A dropped network packet is one thing, but what if the entire server freezes? In virtualized environments (VMware or Hyper-V), failovers accompanied by a massive 100% CPU spike and a multi-minute "hung state" (often lasting 3 to 4 minutes) point to a severe infrastructure bottleneck known as a VM stun.
When a hypervisor takes a VM-level snapshot (typically for a backup), it eventually has to merge those changed storage blocks back into the main virtual disk. On a highly transactional SQL Server, data changes faster than the hypervisor's storage subsystem can consolidate it. The result? The CPU pegs to 100% as I/O queues overflow, and the entire Virtual Machine physically "stuns" or freezes.
If the VM is frozen for 200+ seconds, it obviously cannot send a 1-second cluster heartbeat. The WSFC evicts the node, and your AG fails over.
Phase 1: Hunting the Root Cause
Before you start tweaking timeouts, you must prove whether SQL Server choked the operating system, or if an external force (like a hypervisor snapshot) hijacked the resources.
Because a 200+ second stun often forces the cluster to restart the SQL service (or memory pressure flushes the DMVs), standard ring buffer queries will be empty. Instead, we must interrogate the physical system_health Extended Event files.
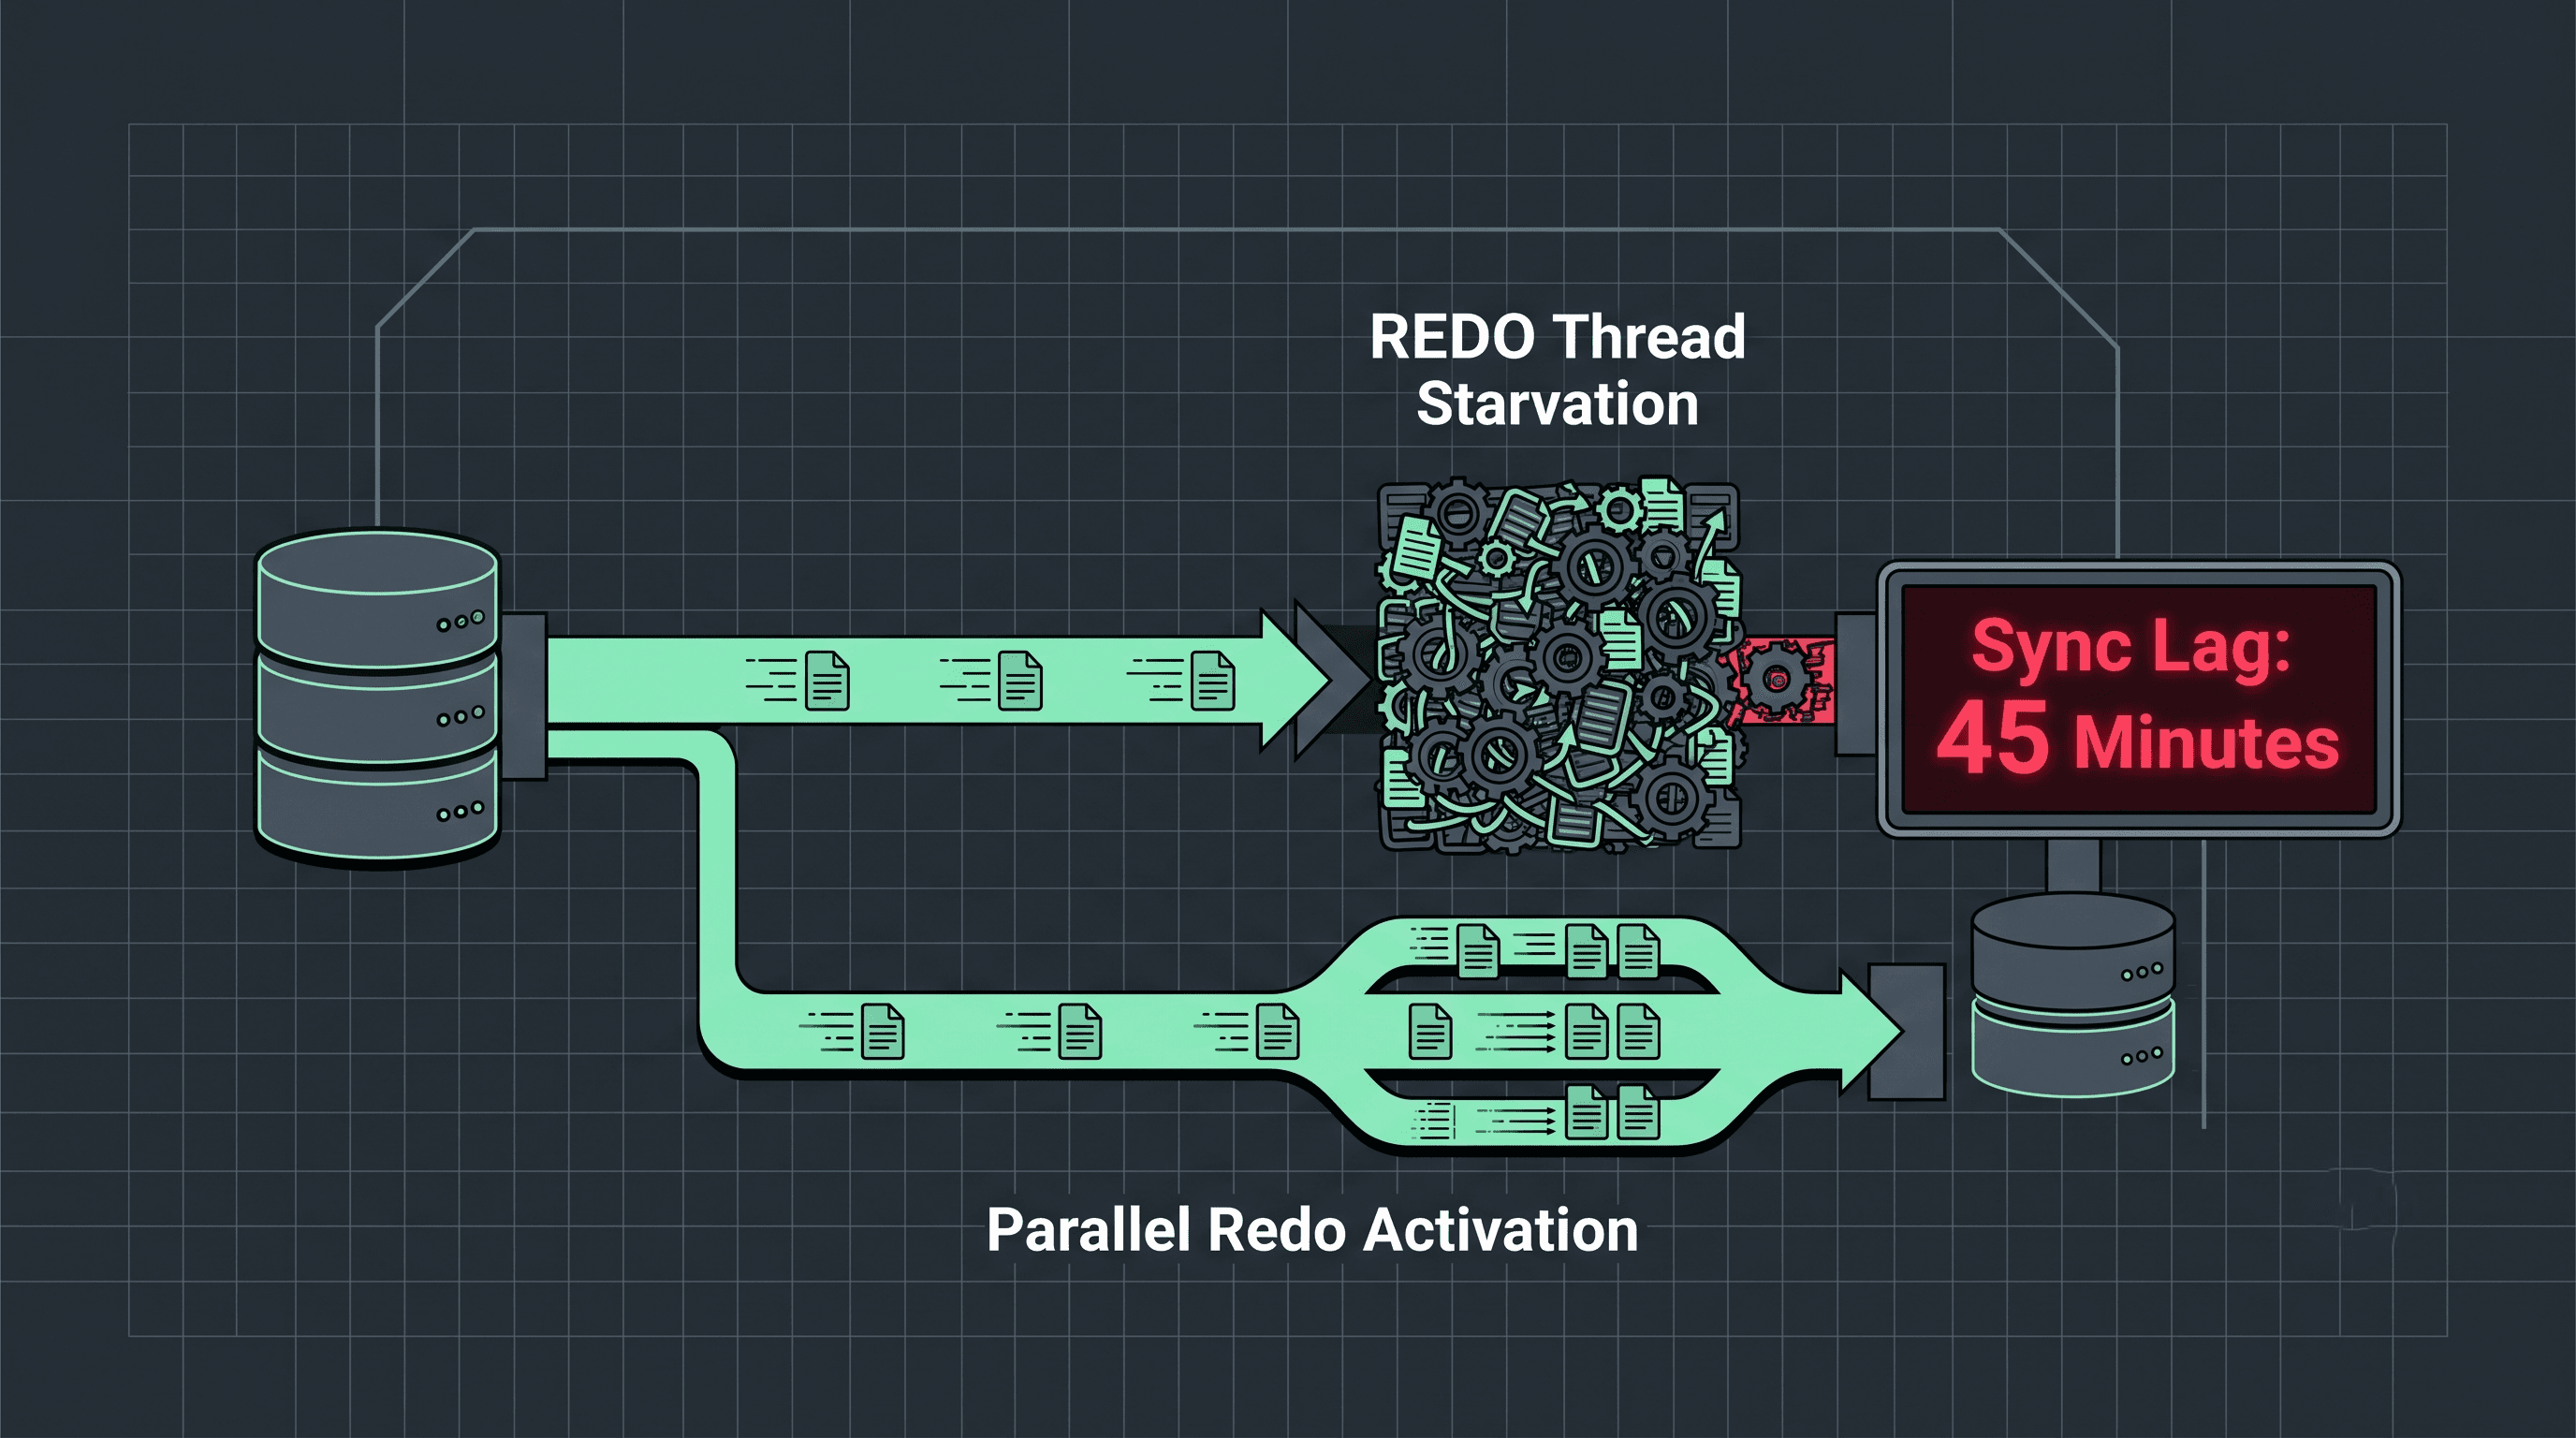
1. Identify Severe Thread Starvation
Did SQL Server run out of worker threads because the CPU was pegged at 100%? Run this script on the node that failed to check the sp_server_diagnostics logs immediately preceding the crash:
DECLARE @FailoverTimeUTC DATETIME2 = '2026-06-06 17:00:00'; -- Set to your failover time (UTC)

SELECT
    event_data.value('(@timestamp)[1]', 'datetime2') AS EventTimeUTC,
    event_data.value('(data[@name="component"]/text)[1]', 'varchar(50)') AS Component,
    event_data.value('(data[@name="state"]/text)[1]', 'varchar(50)') AS HealthState,
    DiagnosticData.value('(maxWorkers)[1]', 'int') AS MaxWorkers,
    DiagnosticData.value('(workersIdle)[1]', 'int') AS WorkersIdle,
    DiagnosticData.value('(pendingTasks)[1]', 'int') AS PendingTasks,
    DiagnosticData.value('(blockedTasksCount)[1]', 'int') AS BlockedTasksCount
FROM (
    SELECT CAST(event_data AS XML) AS event_data
    FROM sys.fn_xe_file_target_read_file('system_health*.xel', NULL, NULL, NULL)
) AS x
CROSS APPLY event_data.nodes('(data[@name="data"]/value/queryProcessing)') AS T(DiagnosticData)
WHERE event_data.value('(@name)[1]', 'varchar(50)') = 'sp_server_diagnostics_component_result'
  AND event_data.value('(data[@name="component"]/text)[1]', 'varchar(50)') = 'QUERY_PROCESSING'
  AND event_data.value('(@timestamp)[1]', 'datetime2') BETWEEN DATEADD(MINUTE, -15, @FailoverTimeUTC) AND DATEADD(MINUTE, 5, @FailoverTimeUTC)
ORDER BY EventTimeUTC DESC;
If WorkersIdle drops to 0 and PendingTasks skyrockets, the CPU spike caused thread starvation.
2. Isolate Severe Blocking Chains
If SQL Server itself caused the CPU spike via a massive blocking chain, the wait_info event will have captured it:
DECLARE @FailoverTimeUTC DATETIME2 = '2026-06-06 17:00:00';

SELECT
    event_data.value('(@timestamp)[1]', 'datetime2') AS EventTimeUTC,
    event_data.value('(data[@name="wait_type"]/text)[1]', 'varchar(50)') AS WaitType,
    event_data.value('(data[@name="duration"]/value)[1]', 'bigint') AS Duration_ms,
    event_data.value('(action[@name="session_id"]/value)[1]', 'int') AS SessionID,
    event_data.value('(action[@name="sql_text"]/value)[1]', 'nvarchar(max)') AS SQLText
FROM (
    SELECT CAST(event_data AS XML) AS event_data
    FROM sys.fn_xe_file_target_read_file('system_health*.xel', NULL, NULL, NULL)
) AS x
WHERE event_data.value('(@name)[1]', 'varchar(50)') = 'wait_info'
  AND event_data.value('(data[@name="wait_type"]/text)[1]', 'varchar(50)') LIKE 'LCK_%'
  AND event_data.value('(@timestamp)[1]', 'datetime2') BETWEEN DATEADD(MINUTE, -15, @FailoverTimeUTC) AND DATEADD(MINUTE, 5, @FailoverTimeUTC)
ORDER BY EventTimeUTC DESC;
Phase 2: Resolving the Architecture
Once you have identified the culprit (and pushed back on the infrastructure team if VM snapshot consolidation is stunning the guest OS), you need to fortify the cluster.
1. Relax the WSFC Heartbeat Thresholds
Microsoft officially recommends relaxing the default cluster heartbeat thresholds for SQL Server, particularly in virtualized or cloud environments. This prevents brief network blips from triggering catastrophic failovers.
Open PowerShell as Administrator on a cluster node and increase the threshold to 20 seconds:
$cluster = Get-Cluster
# For nodes on the same network subnet
$cluster.SameSubnetThreshold = 20

# For nodes on different network subnets (Multi-Subnet clusters)
$cluster.CrossSubnetThreshold = 20
A Crucial Warning: Do not increase your cluster timeouts to cover a 200+ second VM stun. If you set the threshold to 220, your database will be completely unresponsive to the application for almost 4 minutes without triggering a failover. That defeats the entire purpose of High Availability. Fix the stun; use the threshold only for micro-drops.
2. SQL Server Lease Timeouts
SQL Server maintains its own "Lease Timeout" with the Windows Cluster (defaulting to 20 seconds). While it is tempting to increase this, do not change the SQL Lease Timeout unless directed by Microsoft Support. Modifying the WSFC Heartbeat Threshold is the correct architectural approach. Increasing the SQL Lease Timeout too aggressively can result in a genuinely dead SQL instance refusing to fail over, causing extended downtime.
Final Thoughts
Availability Groups provide excellent infrastructure resilience, but they are only as stable as the hardware and hypervisor they run on. When facing Error 1135, stop tuning indexes and start looking at cluster logs, CPU thread starvation, and VM snapshot schedules.
Stop waiting for monitoring alerts to wake you up at 3:00 AM. Give your database the infrastructure resilience it needs to defend its own uptime.